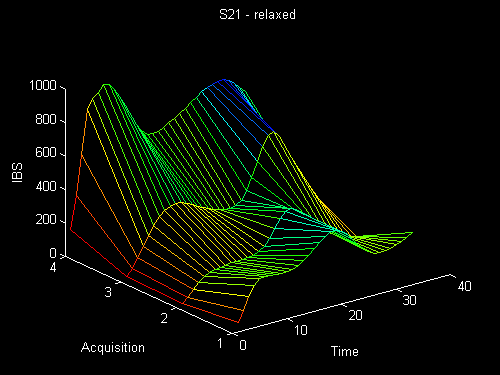
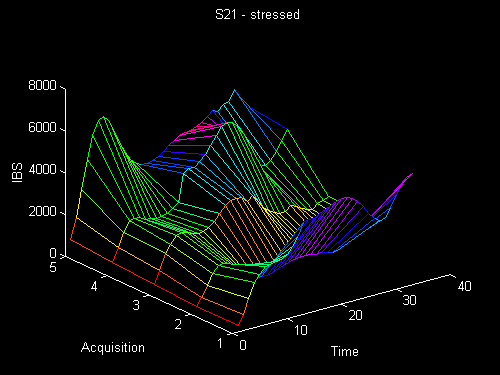
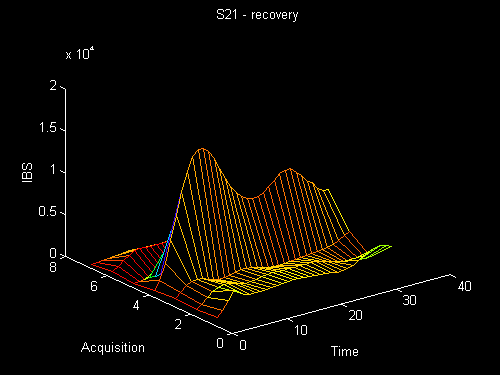
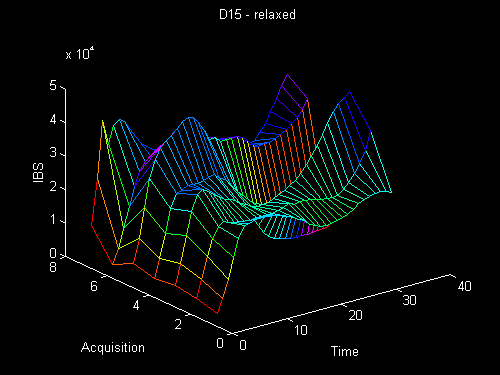
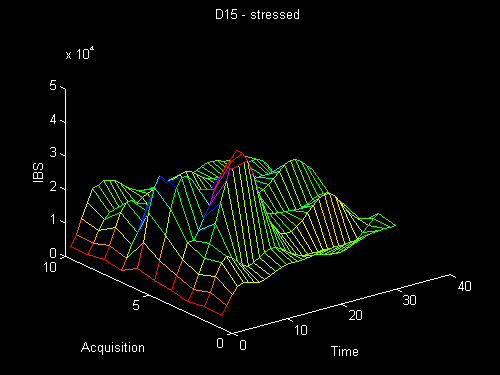
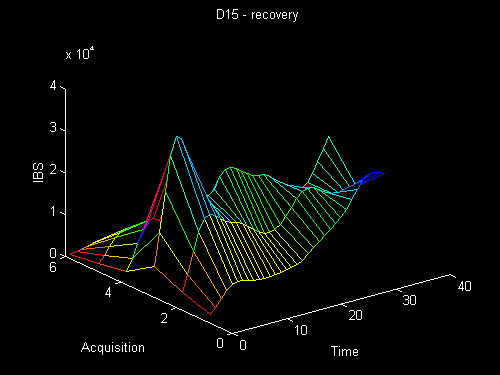
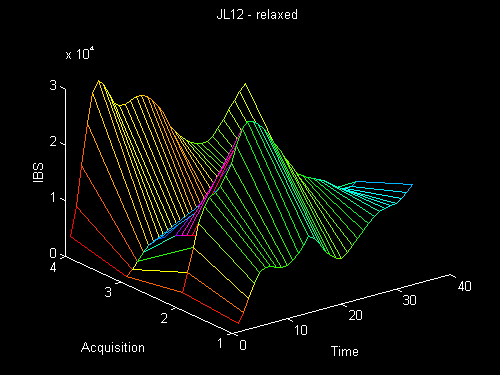
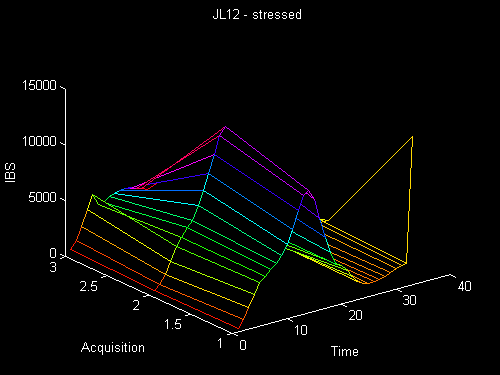
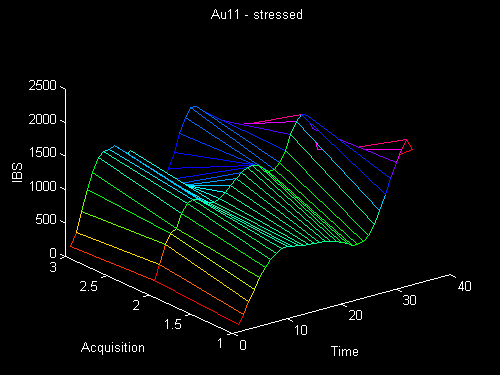
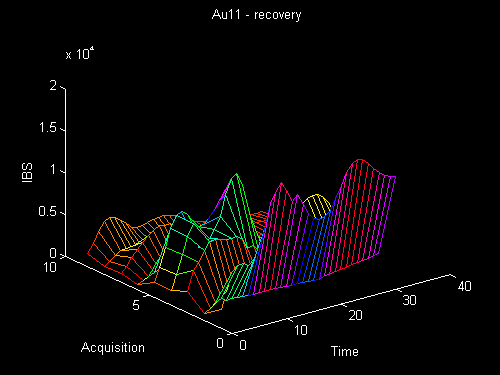
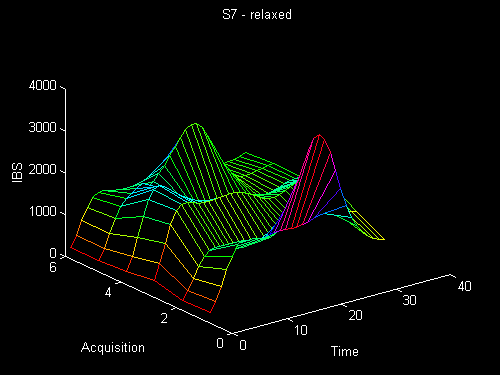
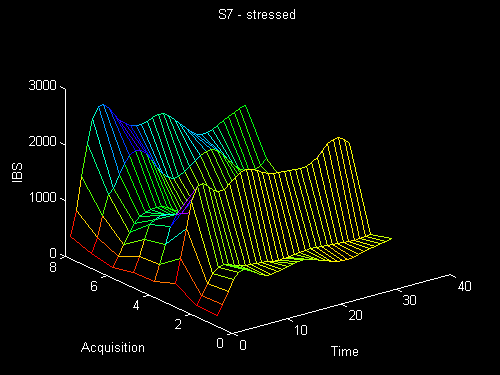
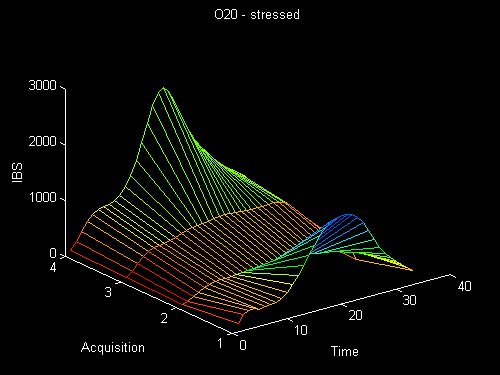
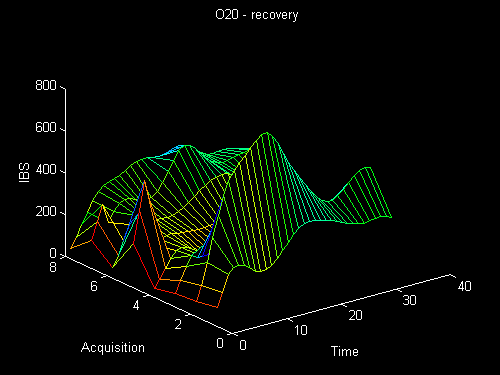
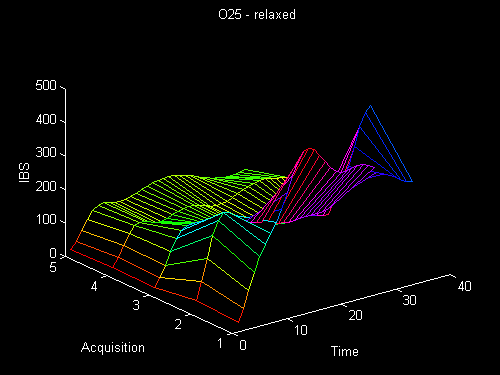
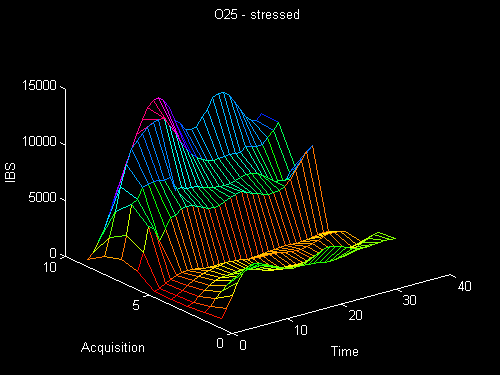
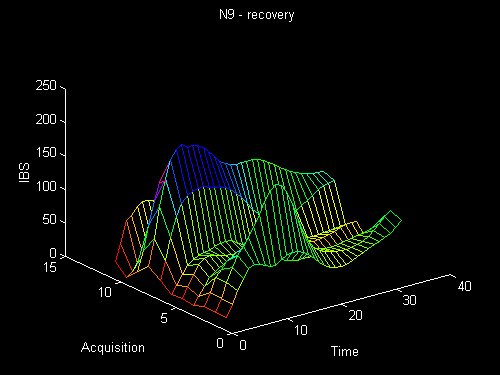
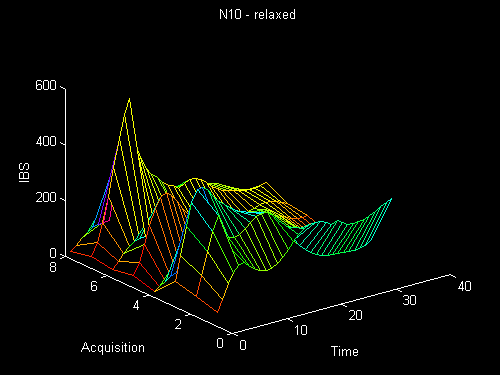
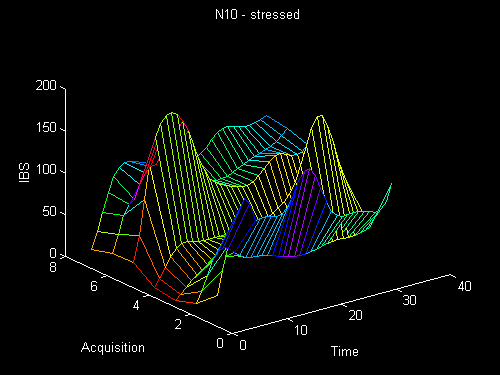
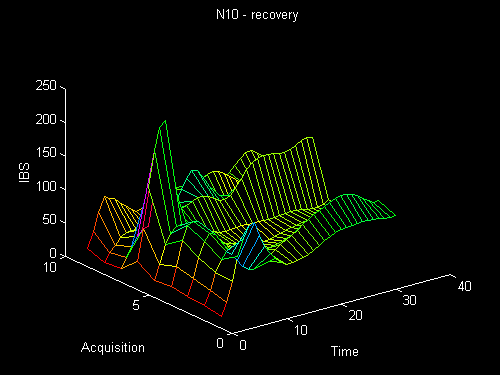
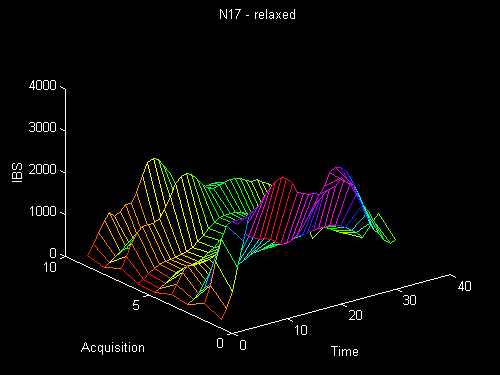
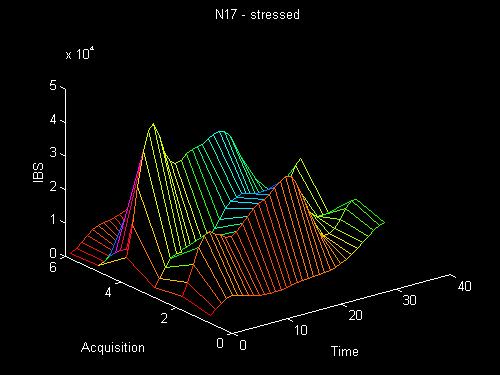
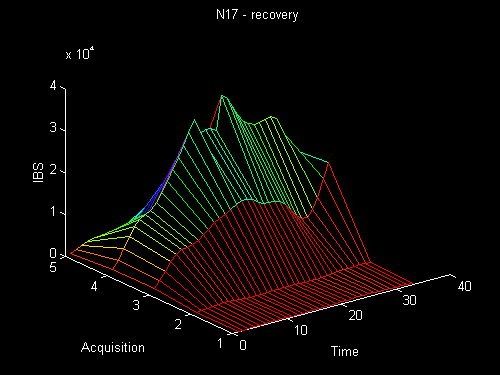
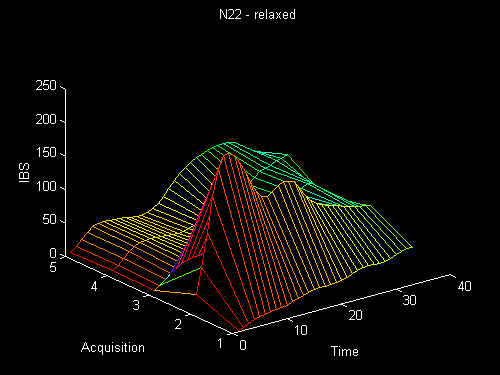
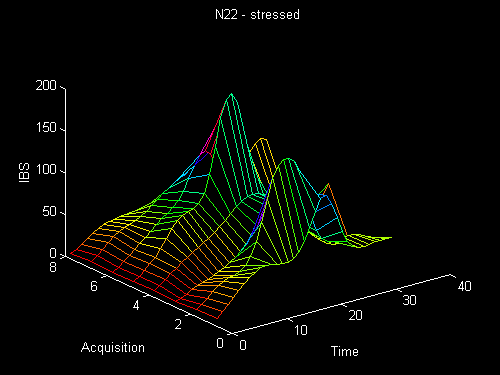
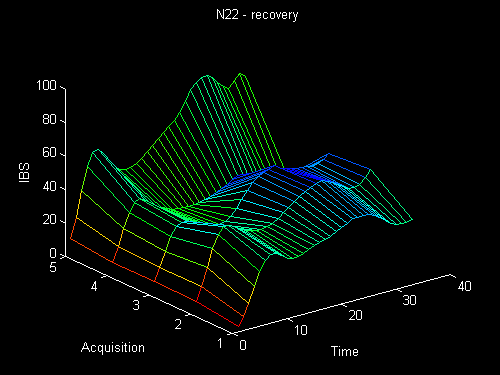
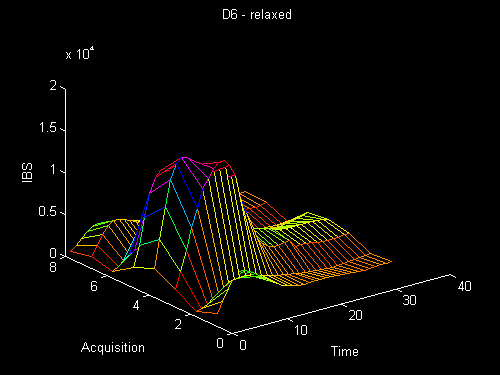
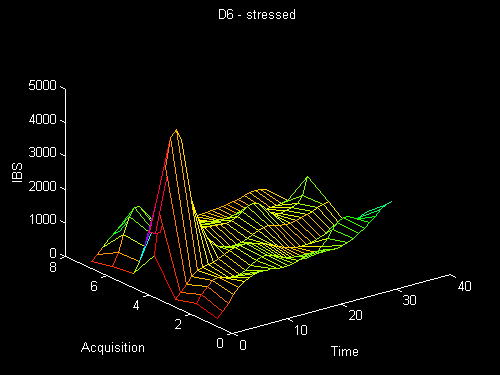
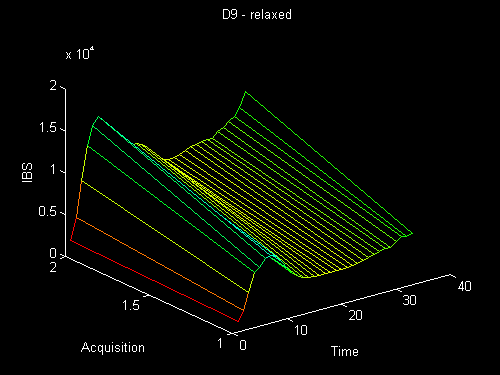
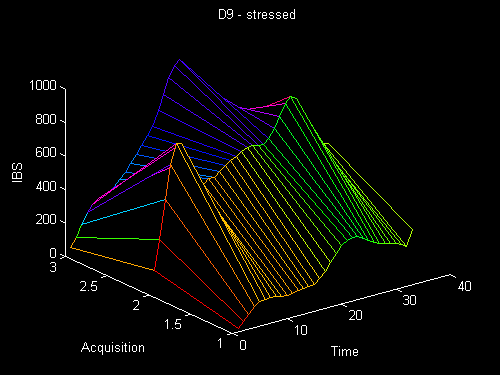
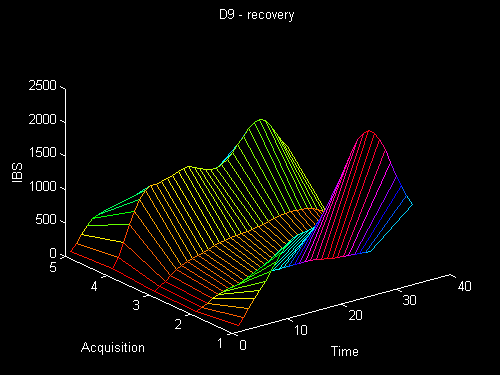
The images below depict the cyclic variation of integrated backscatter during periods of relaxation, stress, and recovery in individuals undergoing dobutamine stress echocardiography. The integrated backscatter was obtained from raw radiofrequency data reflected from the interventricular septum using the parasternal window. The data are not in phase with the cardiac cycle.
Patients undergoing dobutamine stress echocardiography were evaluated using the following method. Resting echocardiograms were performed using standard ultrasound equipment with arrangement to acquire raw radiofrequency ultrasound from a Hitachi EUB165 ultrasound machine. A 2.5 MHz transducer was applied to the chest, and images of the interventricular septum were obtained from the parasternal position. Radiofrequency ultrasound was acquired at rest, and the files were stored after being converted to digital format. As the dobutamine stress proceeded, radiofrequency information was again acquired at peak stress and the files saved as before. Finally, in the recovery period, once the heart rate had returned to normal, a third set of radiofrequency information was digitized in serial files. Integrated backscatter was then calculated in each file as a series of numbers. The tables show the mean integrated backscatter, standard deviation, maximum value, minimum value and range of each acquisition in individual patients. Each stage has an individual table and graph.
The graph images illustrate the temporal pattern of integrated backscatter during these three phases, namely, at rest (relaxed), during dobutamine stress, and in recovery. The radiofrequency ultrasound is displayed using an averaging technique demonstrating the variability between individual acquisitions in each stage as a three-dimensional graph.
It was initially attempted to synchronize the acquisition of radiofrequency ultrasound to the QRS complex of the surface electrocardiogram. This was not technically possible in all patients; hence, the graphs depict the variability of radiofrequency ultrasound through time, but do not begin at any particular point in the cardiac cycle.
Nevertheless, it is possible to discern in the graphs, the cyclic variability of the integrated backscattter.
The next three graphs and tables belong to a 72 year old
female with resting antero septal left ventricular wall
hypokinesis without evident thinning, scar or aneurysm. Two years
prior to the study she suffered a non-Q wave anterior myocardial
infarction. Cardiac catheterization at that time revealed a 40
percent proximal left anterior descending artery stenosis
followed by a 95 percent mid left anterior descending artery
stenosis. This second stenosis was sucessfully opened with
balloon angioplasty.
Dobutamine-atropine stress showed limited improvement in
contractility of the hypokinetic segment.
|
ID |
STAGE |
MEAN |
STD |
MAX |
MIN |
RANGE |
|
s21 |
REST |
327.65 |
80.55 |
450.45 |
0 |
450.45 |
|
s21 |
REST |
200.53 |
91.05 |
412.09 |
18.98 |
393.11 |
|
s21 |
REST |
296.95 |
138.69 |
653.61 |
28.74 |
624.87 |
|
s21 |
REST |
670.66 |
128.21 |
965.82 |
153.33 |
812.49 |
|
ID |
STAGE |
MEAN |
STD |
MAX |
MIN |
RANGE |
|
s21 |
STRESS |
3908.67 |
1184.1 |
5509.52 |
300.69 |
5208.83 |
|
s21 |
STRESS |
1455.31 |
459.63 |
2389.38 |
283.83 |
2105.55 |
|
s21 |
STRESS |
2415.51 |
581.13 |
3491.31 |
460.04 |
3031.27 |
|
s21 |
STRESS |
3762.71 |
1358.32 |
5762.51 |
596.85 |
5165.66 |
|
s21 |
STRESS |
4266.42 |
972.6 |
6204.78 |
772.43 |
5432.35 |
|
ID |
STAGE |
MEAN |
STD |
MAX |
MIN |
RANGE |
|
s21 |
RECOVERY |
2513.68 |
544.14 |
3917.37 |
540.78 |
3376.59 |
|
s21 |
RECOVERY |
1974.6 |
644.7 |
3415.28 |
375.2 |
3040.08 |
|
s21 |
RECOVERY |
1858.86 |
644.8 |
3589.78 |
567.92 |
3021.86 |
|
s21 |
RECOVERY |
8091.63 |
3662.32 |
15853.7 |
437.74 |
15416.0 |
|
s21 |
RECOVERY |
183.85 |
30.83 |
252.62 |
47.5 |
205.12 |
|
s21 |
RECOVERY |
3119.61 |
965.34 |
5077.45 |
359.19 |
4718.26 |
|
s21 |
RECOVERY |
194.44 |
73.97 |
434.97 |
34.32 |
400.65 |
The next three graphs and tables belong to a 77 year old male
with history of prior anterior wall myocardial infarction fifteen
years ago. He suffered from Class III NYHA congestive heart
failure. He was admitted for new onset of exertional chest pain.
Coronary arteriography showed a normal left main, the left
anterior descending artery had a total proximal occlusion, the
left circumflex artery had a 40 percent proximal occlusion, the
obtuse marginal artery was totally occluded, the right coronary
artery was dominant with a 90 percent proximal stenosis.
Dobutamine stress echo showed akinesis and increased reflectivity
of the antero septal left ventricular wall from which the
integrated backscatter was calculated. There was no improvement
in contractility with dobutamine stress.
|
ID |
STAGE |
MEAN |
STD |
MAX |
MIN |
RANGE |
|
d15 |
REST |
28443 |
9043.56 |
49653.0 |
0 |
49653.0 |
|
d15 |
REST |
32653.7 |
12238.6 |
58717.7 |
4382.1 |
54335.6 |
|
d15 |
REST |
44729.6 |
19564.5 |
82195.1 |
5189.1 |
77006.0 |
|
d15 |
REST |
20335.1 |
10720.5 |
39485.0 |
4404.26 |
35080.7 |
|
d15 |
REST |
47748.4 |
14509.2 |
68912.6 |
6014.42 |
62898.2 |
|
d15 |
REST |
41205.4 |
13619.7 |
61357.5 |
3070.82 |
58286.7 |
|
d15 |
REST |
39956.1 |
21310.1 |
70217.84 |
1700.27 |
58517.5 |
|
ID |
STAGE |
MEAN |
STD |
MAX |
MIN |
RANGE |
|
d15 |
STRESS |
14095.5 |
4096.83 |
21348.7 |
2524.29 |
18824.4 |
|
d15 |
STRESS |
12547.2 |
2676.35 |
17377.5 |
2984.8 |
14392.7 |
|
d15 |
STRESS |
20587.8 |
9478.29 |
43444.6 |
2373.45 |
41071.1 |
|
d15 |
STRESS |
21837.6 |
8005.51 |
38665.2 |
3202.7 |
35462.5 |
|
d15 |
STRESS |
15056.6 |
4646.16 |
24078.4 |
2426.36 |
21652.0 |
|
d15 |
STRESS |
20221.9 |
4447.95 |
31388.0 |
5369.54 |
26018.5 |
|
d15 |
STRESS |
19808.1 |
6231.91 |
33376.7 |
2850.81 |
30525.9 |
|
d15 |
STRESS |
16504.0 |
7209.67 |
35708.3 |
3275.11 |
32433.2 |
|
d15 |
STRESS |
14297.7 |
3412 |
19465.3 |
1767.92 |
17697.4 |
|
d15 |
STRESS |
16239.7 |
4003.77 |
25059.7 |
2495.59 |
22564.1 |
|
ID |
STAGE |
MEAN |
STD |
MAX |
MIN |
RANGE |
|
d15 |
RECOVERY |
16290.6 |
8776.86 |
30074.0 |
1112.97 |
28961.1 |
|
d15 |
RECOVERY |
23742.2 |
11389.0 |
46489.6 |
2589.61 |
43900.0 |
|
d15 |
RECOVERY |
30075.6 |
11894.6 |
56281.7 |
6399.1 |
49882.6 |
|
d15 |
RECOVERY |
8188.83 |
3335.9 |
13577.0 |
2231.21 |
11345.8 |
|
d15 |
RECOVERY |
4957.99 |
2106.2 |
9556.87 |
1185.7 |
8371.17 |
|
d15 |
RECOVERY |
2363.88 |
1023.33 |
4628.62 |
209.05 |
4419.57 |
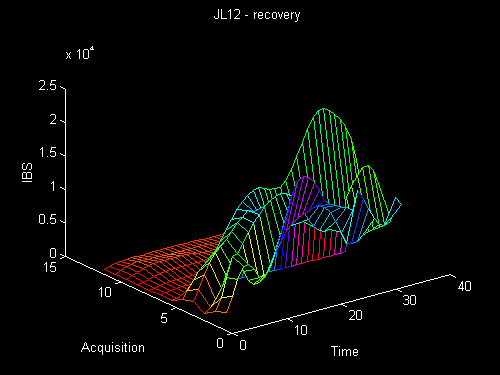
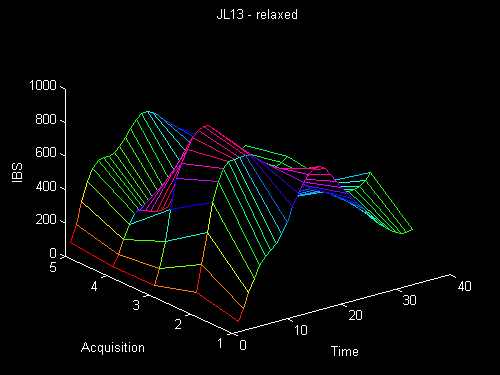
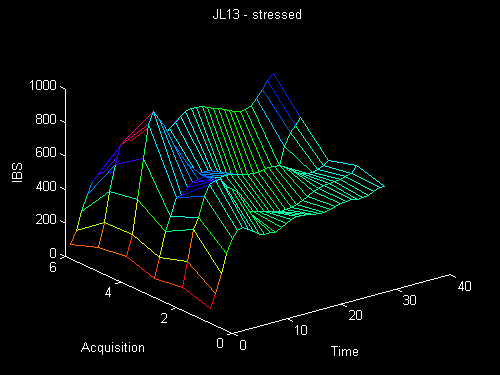
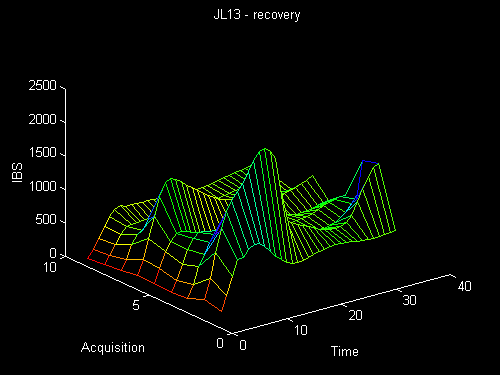
The next three tables and graphs belong to a 67 year old male with resting normal left ventricular wall motion. During dobutamine stress there was no evidence of inducible ischemia, all segments improved with stress including the area sampled for integrated backscatter.
|
ID |
STAGE |
MEAN |
STD |
MAX |
MIN |
RANGE |
|
jl12 |
REST |
13551.0 |
5156.84 |
24100.8 |
1477.12 |
22623.7 |
|
jl12 |
REST |
16997.5 |
5187.25 |
29891.6 |
2569.65 |
27322.0 |
|
jl12 |
REST |
5511.92 |
1483.02 |
9012.45 |
733.7 |
8278.75 |
|
jl12 |
REST |
22175.3 |
6084.71 |
39422.4 |
3427.37 |
35995.0 |
|
ID |
STAGE |
MEAN |
STD |
MAX |
MIN |
RANGE |
|
jl12 |
STRESS |
4673.27 |
3667.23 |
13331.8 |
350.6 |
12981.2 |
|
jl12 |
STRESS |
4479.83 |
3241.88 |
10985.4 |
727.07 |
10258.3 |
|
jl12 |
STRESS |
4713.35 |
2534.79 |
8519.58 |
1640.59 |
6878.99 |
|
jl12 |
STRESS |
3362.48 |
2752.92 |
9318.43 |
272.17 |
9046.26 |
|
ID |
STAGE |
MEAN |
STD |
MAX |
MIN |
RANGE |
|
jl12 |
RECOVERY |
7335.9 |
3043.25 |
11707.9 |
519.94 |
11187.9 |
|
jl12 |
RECOVERY |
12517.4 |
5858.32 |
23674.1 |
2485.47 |
21188.6 |
|
jl12 |
RECOVERY |
8906.93 |
3014.76 |
13146.9 |
1476.63 |
11670.3 |
|
jl12 |
RECOVERY |
10432.4 |
4366.58 |
15970.4 |
431.01 |
15539.4 |
|
jl12 |
RECOVERY |
7293.3 |
2609.14 |
11790.4 |
1366.15 |
10424.3 |
|
jl12 |
RECOVERY |
12174.6 |
3437.33 |
19718.4 |
3295.36 |
16423.0 |
|
jl12 |
RECOVERY |
479.39 |
136.17 |
774.11 |
61.01 |
713.1 |
|
jl12 |
RECOVERY |
707.97 |
277.32 |
1240.86 |
219.38 |
1021.48 |
|
jl12 |
RECOVERY |
586.45 |
166.41 |
834.43 |
91.32 |
743.11 |
|
jl12 |
RECOVERY |
1116.87 |
344.53 |
1666.17 |
191.27 |
1474.9 |
|
jl12 |
RECOVERY |
1222.87 |
356.62 |
1828.91 |
245.15 |
1583.76 |
|
jl12 |
RECOVERY |
1035.46 |
229.64 |
1535.45 |
259.53 |
1275.92 |
|
jl12 |
RECOVERY |
939.95 |
286.24 |
1395.1 |
145.44 |
1249.66 |
|
ID |
STAGE |
MEAN |
STD |
MAX |
MIN |
RANGE |
|
jl13 |
REST |
574.09 |
258.313 |
1068.29 |
0 |
1068.29 |
|
jl13 |
REST |
665.44 |
199.034 |
1111.59 |
128.03 |
983.56 |
|
jl13 |
REST |
541.91 |
199.938 |
920.8 |
49.64 |
871.16 |
|
jl13 |
REST |
472.95 |
168.997 |
778.47 |
46.56 |
731.91 |
|
jl13 |
REST |
496.09 |
151.93 |
734.66 |
77.77 |
656.89 |
|
ID |
STAGE |
MEAN |
STD |
MAX |
MIN |
RANGE |
|
jl13 |
STRESS |
440.86 |
98.574 |
567.52 |
63.31 |
504.21 |
|
jl13 |
STRESS |
513.56 |
127.384 |
716.22 |
114.82 |
601.4 |
|
jl13 |
STRESS |
530.72 |
111.851 |
718.92 |
93.09 |
625.83 |
|
jl13 |
STRESS |
529.49 |
111.811 |
663.09 |
86.94 |
576.15 |
|
jl13 |
STRESS |
695.75 |
153.351 |
884.11 |
121.68 |
762.43 |
|
jl13 |
STRESS |
414.88 |
88.917 |
521.49 |
62.98 |
458.51 |
|
ID |
STAGE |
MEAN |
STD |
MAX |
MIN |
RANGE |
|
jl13 |
RECOVERY |
729.14 |
155.191 |
1056.72 |
196.85 |
859.87 |
|
jl13 |
RECOVERY |
1292.13 |
501.684 |
2265.52 |
249.29 |
2016.23 |
|
jl13 |
RECOVERY |
886.5 |
305.225 |
1655.71 |
152.78 |
1502.93 |
|
jl13 |
RECOVERY |
750.1 |
151.161 |
910.75 |
130.66 |
780.09 |
|
jl13 |
RECOVERY |
629.17 |
125.888 |
863.82 |
158.51 |
705.31 |
|
jl13 |
RECOVERY |
985.2 |
286.102 |
1472.22 |
157.79 |
1314.43 |
|
jl13 |
RECOVERY |
607.59 |
117.776 |
790.1 |
112.19 |
677.91 |
|
jl13 |
RECOVERY |
611.38 |
126.76 |
750.96 |
91.31 |
659.65 |
|
jl13 |
RECOVERY |
675.81 |
152.11 |
818.6 |
73.93 |
744.67 |
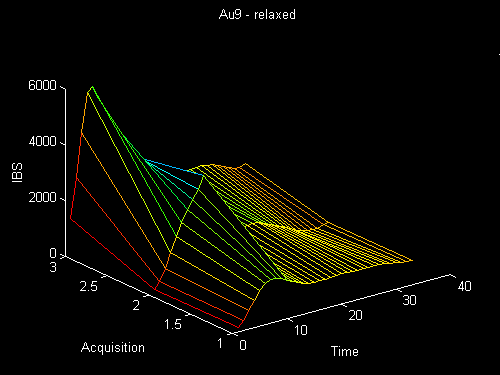
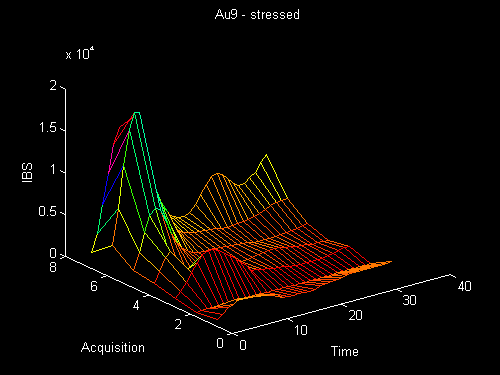
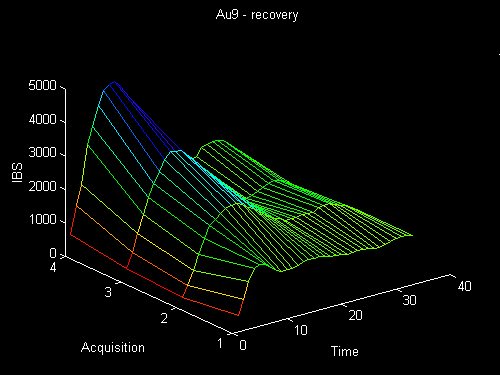
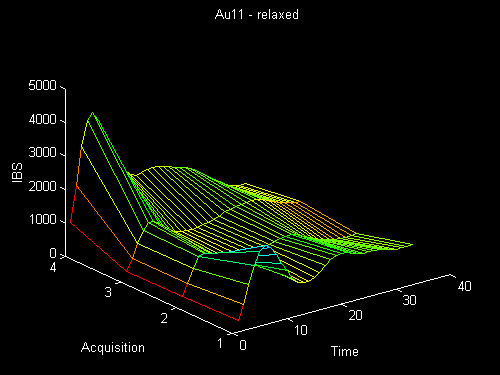
The next three tables and graphs belong to a 76 year old female who at rest showed both normal systolic and diastolic left ventricular function. With dobutamine stress, the left ventricular wall motion improved, exhibiting a normal pattern. The patient did well during vascular surgery.
|
ID |
STAGE |
MEAN |
STD |
MAX |
MIN |
RANGE |
|
au9 |
REST |
1020.63 |
259.05 |
1566.83 |
0 |
1566.83 |
|
au9 |
REST |
1198.43 |
707.02 |
3748.89 |
18.12 |
3730.77 |
|
au9 |
REST |
3646.41 |
1656.44 |
6088.14 |
1307.34 |
4780.8 |
|
ID |
STAGE |
MEAN |
STD |
MAX |
MIN |
RANGE |
|
au9 |
STRESS |
1510.93 |
533.28 |
2523.79 |
325.25 |
2198.54 |
|
au9 |
STRESS |
345.56 |
102.04 |
569.51 |
51.47 |
518.04 |
|
au9 |
STRESS |
1781.04 |
1447.41 |
5282.39 |
591.43 |
4690.96 |
|
au9 |
STRESS |
1313.67 |
761.33 |
4555.44 |
763.11 |
3792.33 |
|
au9 |
STRESS |
3068.33 |
2111.61 |
8346.81 |
1052.66 |
7294.15 |
|
au9 |
STRESS |
8185.04 |
6105.99 |
18691.6 |
1979.75 |
16711.9 |
|
au9 |
STRESS |
4217.23 |
2197.85 |
9750.74 |
1723.6 |
8027.14 |
|
ID |
STAGE |
MEAN |
STD |
MAX |
MIN |
RANGE |
|
au9 |
RECOVERY |
1646.52 |
561.09 |
3135.98 |
480.36 |
2655.62 |
|
au9 |
RECOVERY |
2174.65 |
1053.02 |
4861.52 |
267.02 |
4594.5 |
|
au9 |
RECOVERY |
2408.84 |
1287.77 |
6198.23 |
384.1 |
5814.13 |
|
au9 |
RECOVERY |
3009.95 |
1598.1 |
6847.45 |
626.15 |
6221.3 |
|
ID |
STAGE |
MEAN |
STD |
MAX |
MIN |
RANGE |
|
au11 |
REST |
1424.82 |
380.24 |
2368.29 |
346.75 |
2021.54 |
|
au11 |
REST |
1111 |
346.52 |
2253.56 |
304.21 |
1949.35 |
|
au11 |
REST |
1122.73 |
467.78 |
2530.56 |
594.72 |
1935.84 |
|
au11 |
REST |
1741.35 |
813.91 |
4103.43 |
727.26 |
3376.17 |
|
ID |
STAGE |
MEAN |
STD |
MAX |
MIN |
RANGE |
|
au11 |
STRESS |
1144.38 |
410.85 |
2043.29 |
163.52 |
1879.77 |
|
au11 |
STRESS |
674.43 |
158.73 |
904.75 |
152.92 |
751.83 |
|
au11 |
STRESS |
1308.87 |
419.08 |
2089.43 |
189.46 |
1899.97 |
|
au11 |
STRESS |
1933.5 |
598.51 |
3458.23 |
406.54 |
3051.69 |
|
ID |
STAGE |
MEAN |
STD |
MAX |
MIN |
RANGE |
|
au11 |
RECOVERY |
11835.6 |
3135.47 |
17007.6 |
1573.27 |
15434.4 |
|
au11 |
RECOVERY |
33387.8 |
24511.1 |
84489.4 |
2274.08 |
82215.3 |
|
au11 |
RECOVERY |
22443.4 |
11664.5 |
42069.1 |
4229.09 |
37840.0 |
|
au11 |
RECOVERY |
29849.6 |
18939.1 |
64837.8 |
4495.59 |
60342.2 |
|
au11 |
RECOVERY |
1437.87 |
591.54 |
2800.79 |
411.41 |
2389.38 |
|
au11 |
RECOVERY |
3022.42 |
2185 |
7723.65 |
695.83 |
7027.82 |
|
au11 |
RECOVERY |
4299.44 |
2657.68 |
13105.6 |
1294.11 |
11811.5 |
|
au11 |
RECOVERY |
5491.01 |
2114.95 |
9595.27 |
1296.08 |
8299.19 |
|
au11 |
RECOVERY |
984.83 |
479.79 |
1812.89 |
191.66 |
1621.23 |
|
au11 |
RECOVERY |
2080.14 |
1385.94 |
5130.86 |
572.79 |
4558.07 |
|
au11 |
RECOVERY |
1406.87 |
546.4 |
2270.01 |
403.81 |
1866.2 |
|
au11 |
RECOVERY |
1674.66 |
1038.39 |
3830.48 |
562.68 |
3267.8 |
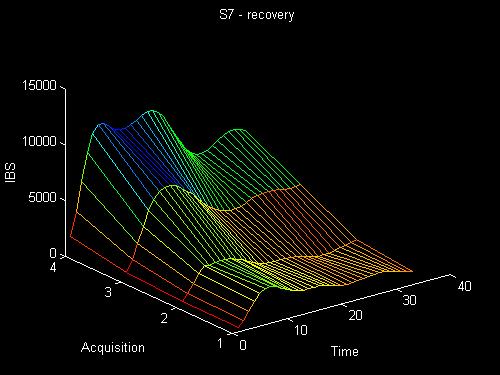
The next three tables and graphs belong to a 67 year old female with echocardiographic evidence of inferior myocardial infarction. During dobutamine stress echo there was mild improvement in the contractility of the interventricular septum from which the integrated backscatter was obtained. The inferior wall, which is not sampled for backscatter, did not improve with stress.
|
ID |
STAGE |
MEAN |
STD |
MAX |
MIN |
RANGE |
|
s7 |
REST |
1394.73 |
855.9 |
3711.08 |
150.25 |
3560.83 |
|
s7 |
REST |
1029.42 |
205.74 |
1306.12 |
149.65 |
1156.47 |
|
s7 |
REST |
1642.26 |
270.44 |
1971.91 |
313.16 |
1658.75 |
|
s7 |
REST |
1343.71 |
293.41 |
2067.4 |
225.88 |
1841.52 |
|
s7 |
REST |
1454.7 |
558.08 |
2833.15 |
185.11 |
2648.04 |
|
s7 |
REST |
1245.79 |
225.78 |
1610.67 |
194.5 |
1416.17 |
|
ID |
STAGE |
MEAN |
STD |
MAX |
MIN |
RANGE |
|
s7 |
STRESS |
669.24 |
175.55 |
1026.45 |
132.51 |
893.94 |
|
s7 |
STRESS |
562.14 |
95.49 |
732.89 |
129.81 |
603.08 |
|
s7 |
STRESS |
1765.04 |
346.81 |
2186.45 |
351.22 |
1835.23 |
|
s7 |
STRESS |
1146.36 |
209.92 |
1432.9 |
222.38 |
1210.52 |
|
s7 |
STRESS |
984.16 |
175.25 |
1313.54 |
209.7 |
1103.84 |
|
s7 |
STRESS |
826.58 |
191.25 |
1115.27 |
131.57 |
983.7 |
|
s7 |
STRESS |
1438.97 |
463.76 |
2310.47 |
203.01 |
2107.46 |
|
s7 |
STRESS |
1847.24 |
400.31 |
2542.92 |
328.48 |
2214.44 |
|
ID |
STAGE |
MEAN |
STD |
MAX |
MIN |
RANGE |
|
s7 |
RECOVERY |
1907.18 |
644.32 |
3308.25 |
386.09 |
2922.16 |
|
s7 |
RECOVERY |
1690.28 |
688.14 |
3195.01 |
417.69 |
2777.32 |
|
s7 |
RECOVERY |
4505.54 |
1223.35 |
7466.1 |
773.23 |
6692.87 |
|
s7 |
RECOVERY |
7365.06 |
2067.15 |
11080.9 |
1709.67 |
9371.24 |
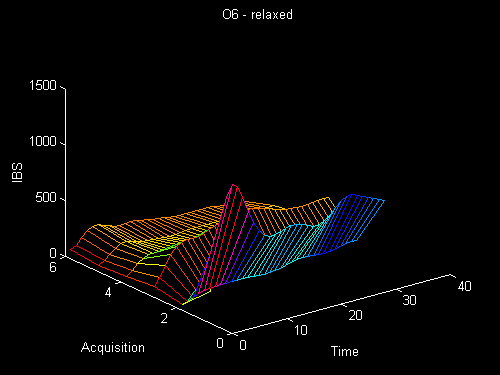
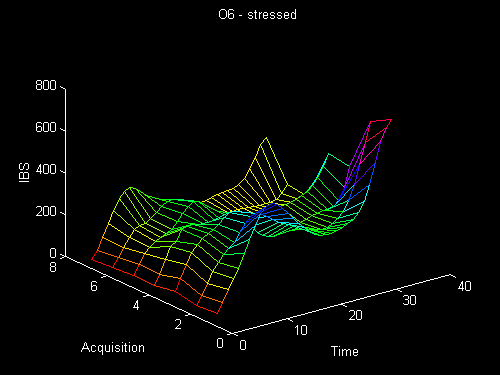
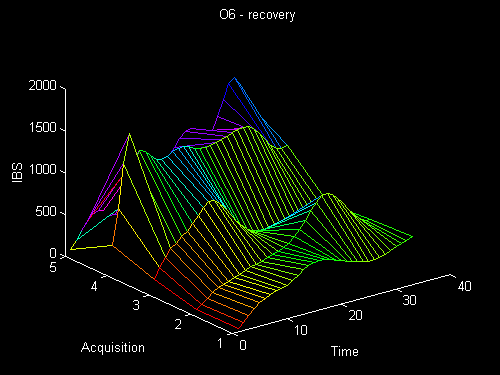
The next three tables and graphs belong to a 58 year old male who suffered a non-Q wave myocardial infarction involving the lateral left ventricular wall. The echocardiogram revealed resting lateral left ventricular wall hypokinesis which showed mild improvement in contractility with stress. The integrated backscatter was obtained from the unaffected septum which showed improved contractility.
|
ID |
STAGE |
MEAN |
STD |
MAX |
MIN |
RANGE |
|
o6 |
REST |
770.16 |
270.132 |
1499.53 |
0 |
1499.53 |
|
o6 |
REST |
114.59 |
32.331 |
169.07 |
14.02 |
155.05 |
|
o6 |
REST |
446.35 |
101.623 |
599.82 |
60.72 |
539.1 |
|
o6 |
REST |
205.04 |
66.376 |
360.26 |
39.35 |
320.91 |
|
o6 |
REST |
139.67 |
36.019 |
222.7 |
24.85 |
197.85 |
|
o6 |
REST |
108.66 |
40.582 |
209.51 |
54.3 |
155.21 |
|
ID |
STAGE |
MEAN |
STD |
MAX |
MIN |
RANGE |
|
o6 |
STRESS |
378.87 |
164.702 |
742.37 |
42.26 |
700.11 |
|
o6 |
STRESS |
345.08 |
168.81 |
729.19 |
33.73 |
695.46 |
|
o6 |
STRESS |
306.15 |
152.398 |
707.8 |
54.72 |
653.08 |
|
o6 |
STRESS |
298.65 |
111.682 |
560.4 |
38.5 |
521.9 |
|
o6 |
STRESS |
200.68 |
68.515 |
323.34 |
42.64 |
280.7 |
|
o6 |
STRESS |
207.73 |
92.308 |
448.98 |
35.01 |
413.97 |
|
o6 |
STRESS |
217.22 |
83.12 |
382.25 |
26.07 |
356.18 |
|
ID |
STAGE |
MEAN |
STD |
MAX |
MIN |
RANGE |
|
o6 |
RECOVERY |
532.1 |
242.821 |
1107.27 |
43.49 |
1063.78 |
|
o6 |
RECOVERY |
524.26 |
254.518 |
1004.21 |
35.53 |
968.68 |
|
o6 |
RECOVERY |
593 |
201.452 |
956.27 |
171.86 |
784.41 |
|
o6 |
RECOVERY |
1184.92 |
209.78 |
1637.17 |
351.84 |
1285.33 |
|
o6 |
RECOVERY |
729.05 |
388.982 |
1596.74 |
74.66 |
1522.08 |
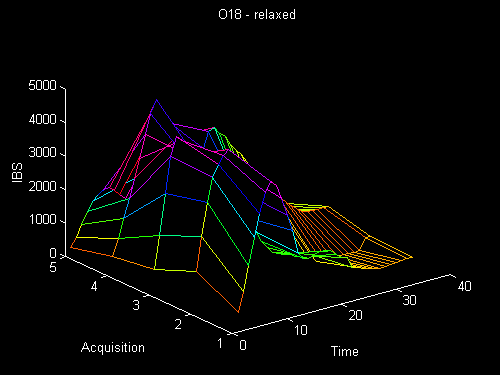
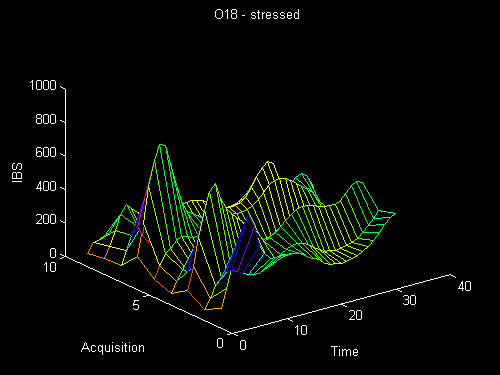
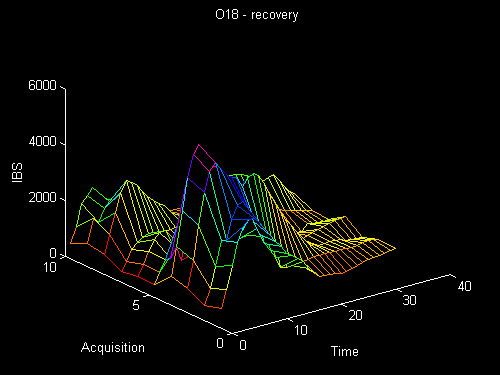
The next three tables and graphs belong to a 44 year old female with normal resting wall motion with improved contractility during dobutamine stress.
|
ID |
STAGE |
MEAN |
STD |
MAX |
MIN |
RANGE |
|
o18 |
REST |
1598.59 |
918.24 |
4242.09 |
573.14 |
3668.95 |
|
o18 |
REST |
2280.01 |
1431.32 |
4803.26 |
527.19 |
4276.07 |
|
o18 |
REST |
2530.62 |
1089.04 |
4502.97 |
724.67 |
3778.3 |
|
o18 |
REST |
1616.58 |
1067.35 |
4861.76 |
480.74 |
4381.02 |
|
o18 |
REST |
759.44 |
537.61 |
2000.71 |
229.97 |
1770.74 |
|
ID |
STAGE |
MEAN |
STD |
MAX |
MIN |
RANGE |
|
o18 |
STRESS |
303.12 |
113.14 |
615.89 |
94.61 |
521.28 |
|
o18 |
STRESS |
247.21 |
101.61 |
521.18 |
43.04 |
478.14 |
|
o18 |
STRESS |
415.37 |
113.22 |
703.03 |
108.38 |
594.65 |
|
o18 |
STRESS |
181.84 |
42.42 |
257.54 |
49.59 |
207.95 |
|
o18 |
STRESS |
334.75 |
93.66 |
487.05 |
84.72 |
402.33 |
|
o18 |
STRESS |
352.24 |
183.55 |
809.03 |
176.28 |
632.75 |
|
o18 |
STRESS |
158.79 |
37.49 |
282.18 |
78.17 |
204.01 |
|
o18 |
STRESS |
252.87 |
69.32 |
389.22 |
70.41 |
318.81 |
|
o18 |
STRESS |
115.89 |
22.83 |
160.58 |
57 |
103.58 |
|
ID |
STAGE |
MEAN |
STD |
MAX |
MIN |
RANGE |
|
o18 |
RECOVERY |
1502.22 |
930.44 |
3509.98 |
554.08 |
2955.9 |
|
o18 |
RECOVERY |
1647.28 |
898.54 |
3751.35 |
391.83 |
3359.52 |
|
o18 |
RECOVERY |
2417.62 |
1365.58 |
4996.27 |
739.21 |
4257.06 |
|
o18 |
RECOVERY |
2092.64 |
1255.32 |
5360.78 |
859.77 |
4501.01 |
|
o18 |
RECOVERY |
1084.34 |
227.75 |
1764.98 |
313.74 |
1451.24 |
|
o18 |
RECOVERY |
1660.99 |
926.22 |
4442.87 |
328.72 |
4114.15 |
|
o18 |
RECOVERY |
1706.02 |
595.97 |
2629.51 |
246.61 |
2382.9 |
|
o18 |
RECOVERY |
1249.49 |
696.68 |
3012.29 |
590.32 |
2421.97 |
|
o18 |
RECOVERY |
1918.99 |
1962.46 |
7688.35 |
528.24 |
7160.11 |
|
o18 |
RECOVERY |
1783.39 |
1871.74 |
6694.34 |
417.41 |
6276.93 |
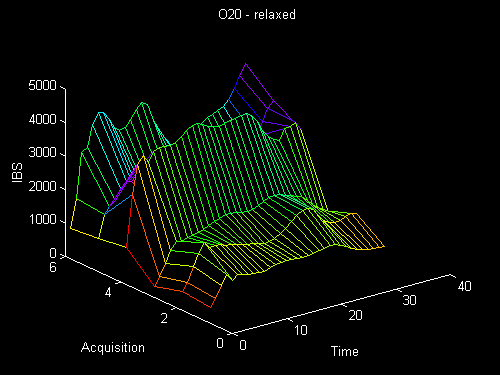
The next three tables and graphs belong to a 49 year old female who was evaluated with dobutamine stress echocardiography prior to vascular surgery. There was resting infero septal left ventricular wall hypokinesis. There was no improvement at low level dobutamine stress indicating limited myocardial viability in the infero septal region. With peak stress the contractility improved in all segments of the left ventricular wall including the regions sampled for integrated backscatter.
|
ID |
STAGE |
MEAN |
STD |
MAX |
MIN |
RANGE |
|
o20 |
REST |
1015.34 |
192.258 |
1342.33 |
359.67 |
982.66 |
|
o20 |
REST |
1190.92 |
320.166 |
1905.4 |
445.03 |
1460.37 |
|
o20 |
REST |
1368.1 |
333.629 |
1964.14 |
207.84 |
1756.3 |
|
o20 |
REST |
3001.2 |
706.13 |
4125.75 |
992.87 |
3132.88 |
|
o20 |
REST |
2275.97 |
779.147 |
3614.89 |
881.94 |
2732.95 |
|
o20 |
REST |
3219.96 |
650.417 |
4479.29 |
789.27 |
3690.02 |
|
ID |
STAGE |
MEAN |
STD |
MAX |
MIN |
RANGE |
|
o20 |
STRESS |
817.49 |
494.591 |
1578.42 |
158.56 |
1419.86 |
|
o20 |
STRESS |
278.51 |
80.552 |
353.36 |
29.13 |
324.23 |
|
o20 |
STRESS |
714.99 |
233.081 |
945.02 |
87.51 |
857.51 |
|
o20 |
STRESS |
778.27 |
217.661 |
937.94 |
104.24 |
833.7 |
|
o20 |
STRESS |
510.96 |
153.77 |
651.91 |
59.04 |
592.87 |
|
o20 |
STRESS |
566.99 |
167.78 |
709.69 |
66.67 |
643.02 |
|
o20 |
STRESS |
1182.61 |
696.284 |
2559.34 |
94.91 |
2464.43 |
|
ID |
STAGE |
MEAN |
STD |
MAX |
MIN |
RANGE |
|
o20 |
RECOVERY |
253.86 |
69.015 |
361.38 |
70.65 |
290.73 |
|
o20 |
RECOVERY |
478.17 |
165.32 |
769.76 |
53.3 |
716.46 |
|
o20 |
RECOVERY |
224.04 |
48.479 |
283.84 |
47 |
236.84 |
|
o20 |
RECOVERY |
172.32 |
36.347 |
215.97 |
26.06 |
189.91 |
|
o20 |
RECOVERY |
223.21 |
54.06 |
480.99 |
157.25 |
323.74 |
|
o20 |
RECOVERY |
245.58 |
60.09 |
336.83 |
33.74 |
303.09 |
|
o20 |
RECOVERY |
288.54 |
73.41 |
448.96 |
114.35 |
334.61 |
|
o20 |
RECOVERY |
261.53 |
85.56 |
383.89 |
33.44 |
350.45 |
|
ID |
STAGE |
MEAN |
STD |
MAX |
MIN |
RANGE |
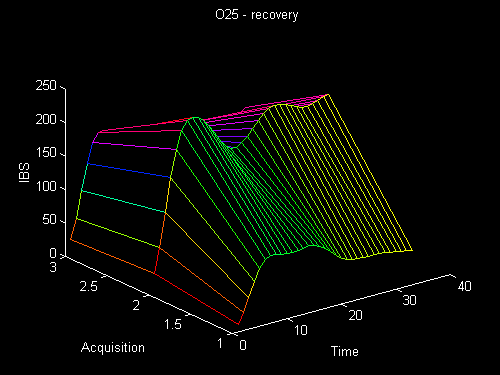
|
o25 |
REST |
304.78 |
113.52 |
492.01 |
0 |
492.01 |
|
o25 |
REST |
257.02 |
85.67 |
477.11 |
38.24 |
438.87 |
|
o25 |
REST |
130.65 |
45.94 |
281.61 |
18.9 |
262.71 |
|
o25 |
REST |
137.03 |
40.33 |
244.64 |
20.25 |
224.39 |
|
o25 |
REST |
116.67 |
34.04 |
169.85 |
16.47 |
153.38 |
|
ID |
STAGE |
MEAN |
STD |
MAX |
MIN |
RANGE |
|
o25 |
STRESS |
3484.89 |
788.84 |
4641.99 |
552.32 |
4089.67 |
|
o25 |
STRESS |
2928.79 |
1031.99 |
4818.19 |
373.96 |
4444.23 |
|
o25 |
STRESS |
1648.13 |
385.65 |
2167.69 |
199.25 |
1968.44 |
|
o25 |
STRESS |
1770.83 |
403.59 |
2239.16 |
183.21 |
2055.95 |
|
o25 |
STRESS |
1143.37 |
268.39 |
1540.44 |
160.32 |
1380.12 |
|
o25 |
STRESS |
6743.14 |
1954.48 |
10650.3 |
1283.16 |
9367.16 |
|
o25 |
STRESS |
6804.44 |
1512.01 |
9587.82 |
1646.4 |
7941.42 |
|
o25 |
STRESS |
10148.7 |
3045.55 |
15830.6 |
1231.77 |
14598.9 |
|
o25 |
STRESS |
9538.03 |
3255.77 |
14176.2 |
316.47 |
13859.7 |
|
ID |
STAGE |
MEAN |
STD |
MAX |
MIN |
RANGE |
|
o25 |
RECOVERY |
66.05 |
19.34 |
100.73 |
11.14 |
89.59 |
|
o25 |
RECOVERY |
199.58 |
38.95 |
248.03 |
29.41 |
218.62 |
|
o25 |
RECOVERY |
163.7 |
36.01 |
235.32 |
22.92 |
212.4 |
The next three tables and graphs belong to a 61 year old male who underwent dobutamine stress echocardiography prior to vascular surgery. The resting images revealed normal left ventricular contractility. There were no resting or stress induced left ventricular wall motion abnormalities during dobutamine stress echocardiography. The patient underwent surgery uneventfully.
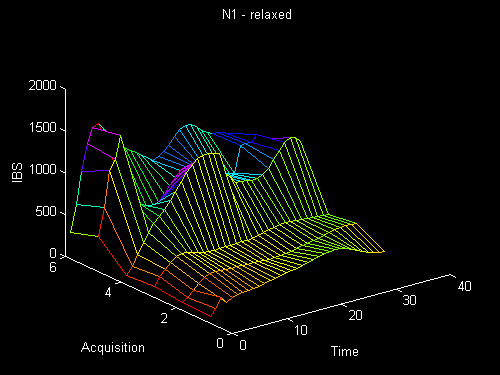
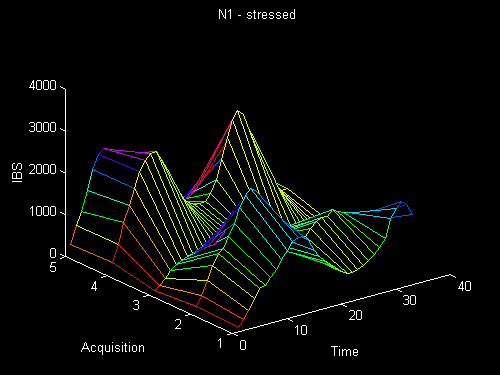
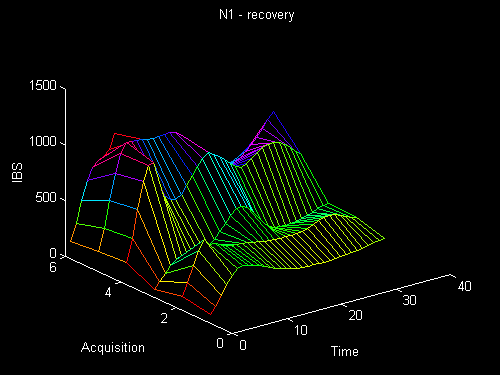
|
ID |
STAGE |
MEAN |
STD |
MAX |
MIN |
RANGE |
|
n1 |
REST |
286.94 |
76.001 |
426.19 |
36.82 |
389.37 |
|
n1 |
REST |
340.87 |
87.383 |
519.2 |
43.39 |
475.81 |
|
n1 |
REST |
417.39 |
132.927 |
794.29 |
86.73 |
707.56 |
|
n1 |
REST |
806.51 |
274.72 |
1255.2 |
68.11 |
1187.09 |
|
n1 |
REST |
684.7 |
236.546 |
1511.31 |
383.52 |
1127.79 |
|
n1 |
REST |
922.42 |
228.2 |
1483.88 |
270.49 |
1213.39 |
|
ID |
STAGE |
MEAN |
STD |
MAX |
MIN |
RANGE |
|
n1 |
STRESS |
1329.43 |
620.169 |
2551.18 |
220.92 |
2330.26 |
|
n1 |
STRESS |
1272.1 |
543.56 |
2613.38 |
156.67 |
2456.71 |
|
n1 |
STRESS |
705.79 |
170.019 |
901.14 |
72.51 |
828.63 |
|
n1 |
STRESS |
1523.41 |
690.384 |
3118.92 |
298.13 |
2820.79 |
|
n1 |
STRESS |
1212.49 |
507.845 |
2342.57 |
252.75 |
2089.82 |
|
ID |
STAGE |
MEAN |
STD |
MAX |
MIN |
RANGE |
|
n1 |
RECOVERY |
290.45 |
74.522 |
467.43 |
40.12 |
427.31 |
|
n1 |
RECOVERY |
498.43 |
188.577 |
981.27 |
90.42 |
890.85 |
|
n1 |
RECOVERY |
358.74 |
113.875 |
573.27 |
41.5 |
531.77 |
|
n1 |
RECOVERY |
860.48 |
326.681 |
2126.18 |
165.34 |
1960.84 |
|
n1 |
RECOVERY |
1078.1 |
544.031 |
2823.07 |
151.09 |
2671.98 |
|
n1 |
RECOVERY |
358.1 |
106.754 |
585.15 |
129.53 |
455.62 |
The next three tables and graphs belong to a 64 year old male who exhibited diffuse left ventricular hypokinesis at rest. With stress, there was no improvement in the contractility of the interventricular septum, from which the integrated backscatter was sampled.
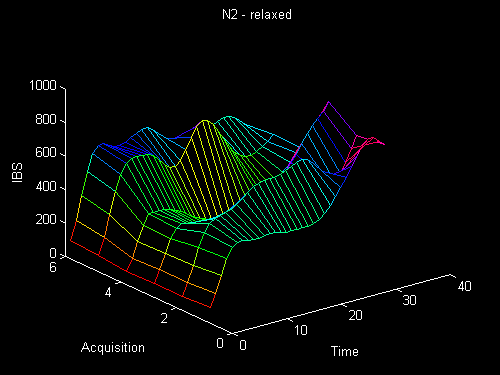
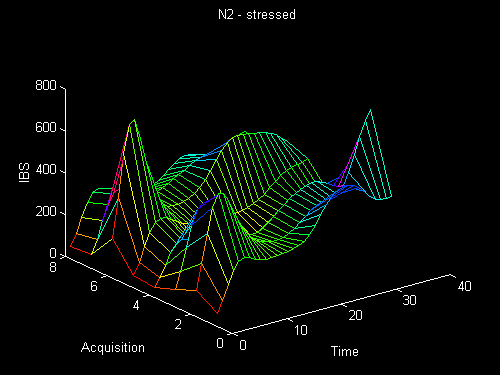
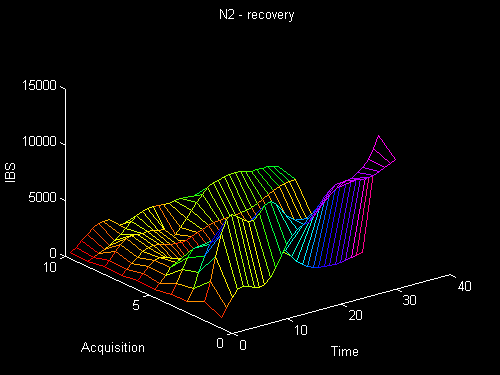
|
ID |
STAGE |
MEAN |
STD |
MAX |
MIN |
RANGE |
|
n2 |
REST |
466.71 |
187.75 |
823.71 |
67.17 |
756.54 |
|
n2 |
REST |
610.64 |
182.65 |
865.55 |
58.22 |
807.33 |
|
n2 |
REST |
510.72 |
245.76 |
1053.48 |
62.73 |
990.75 |
|
n2 |
REST |
387.91 |
148.93 |
719.21 |
53.92 |
665.29 |
|
n2 |
REST |
561.55 |
151.55 |
896.46 |
77.37 |
819.09 |
|
n2 |
REST |
560.72 |
167.71 |
937.14 |
86.9 |
850.24 |
|
ID |
STAGE |
MEAN |
STD |
MAX |
MIN |
RANGE |
|
n2 |
STRESS |
333.81 |
104.33 |
484.63 |
44.12 |
440.51 |
|
n2 |
STRESS |
502.52 |
271.69 |
925.27 |
85.53 |
839.74 |
|
n2 |
STRESS |
412.97 |
87.48 |
535.95 |
76.33 |
459.62 |
|
n2 |
STRESS |
201.9 |
66.18 |
277.36 |
29.72 |
247.64 |
|
n2 |
STRESS |
307.09 |
131.4 |
575.45 |
42.23 |
533.22 |
|
n2 |
STRESS |
412.63 |
115.01 |
711.65 |
172.64 |
539.01 |
|
n2 |
STRESS |
376.57 |
143.05 |
679.85 |
46.84 |
633.01 |
|
n2 |
STRESS |
278.18 |
74.39 |
374.48 |
40.08 |
334.4 |
|
ID |
STAGE |
MEAN |
STD |
MAX |
MIN |
RANGE |
|
n2 |
RECOVERY |
8144.26 |
3608.4 |
12666.9 |
628.76 |
12038.2 |
|
n2 |
RECOVERY |
4845.08 |
1547.62 |
8938.21 |
1851.42 |
7086.79 |
|
n2 |
RECOVERY |
3028.84 |
2080.49 |
6323.56 |
469.59 |
5853.97 |
|
n2 |
RECOVERY |
3612.47 |
1746.44 |
7424.84 |
632.24 |
6792.6 |
|
n2 |
RECOVERY |
2467.22 |
822.5 |
3936.57 |
342.6 |
3593.97 |
|
n2 |
RECOVERY |
1573.8 |
446.9 |
2329.12 |
495.88 |
1833.24 |
|
n2 |
RECOVERY |
3039.53 |
1282.59 |
5152.01 |
276.53 |
4875.48 |
|
n2 |
RECOVERY |
3689.17 |
1632.02 |
5646.46 |
354.91 |
5291.55 |
|
n2 |
RECOVERY |
1997.65 |
824.6 |
3572.63 |
178.89 |
3393.74 |
|
n2 |
RECOVERY |
1421.78 |
351.1 |
2278.04 |
266.45 |
2011.59 |
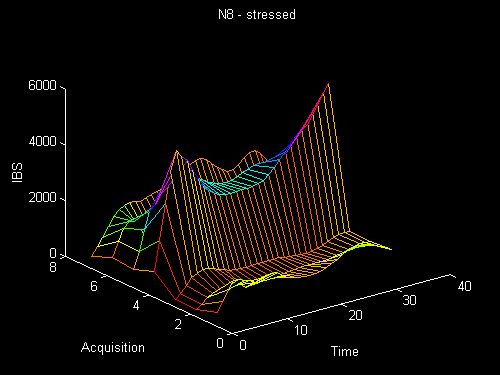
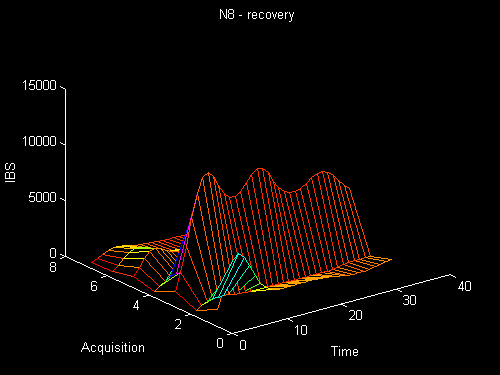
The next three tables and graphs belong to a 81 year old female with normal, resting left ventricular wall motion. There were no wall motion abnormalities with dobutamine stress echocardiography. Her left ventricular cavity was small at peak stress - a normal finding.
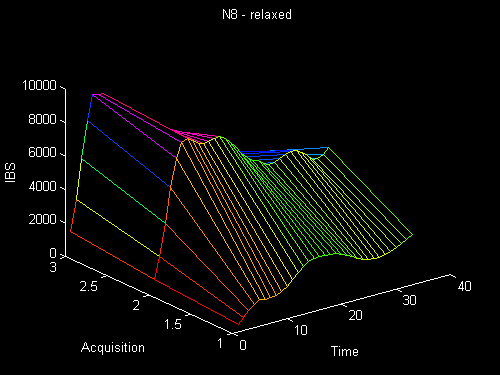
|
ID |
STAGE |
MEAN |
STD |
MAX |
MIN |
RANGE |
|
n8 |
REST |
2317.84 |
716.58 |
3462.27 |
453.74 |
3008.53 |
|
n8 |
REST |
7215.12 |
1894.03 |
12176.5 |
818.6 |
11357.9 |
|
n8 |
REST |
5518.7 |
2639.32 |
11819.8 |
1433.77 |
10386.0 |
|
ID |
STAGE |
MEAN |
STD |
MAX |
MIN |
RANGE |
|
n8 |
STRESS |
1297.11 |
419.16 |
2136.89 |
348.08 |
1788.81 |
|
n8 |
STRESS |
998.59 |
626.39 |
2234.41 |
110.88 |
2123.53 |
|
n8 |
STRESS |
920.07 |
413.87 |
2009.01 |
129.11 |
1879.9 |
|
n8 |
STRESS |
4261.21 |
1420.27 |
6680.75 |
777.52 |
5903.23 |
|
n8 |
STRESS |
3145.39 |
665.5 |
4257.4 |
603.73 |
3653.67 |
|
n8 |
STRESS |
801.29 |
300.76 |
1735.9 |
486.41 |
1249.49 |
|
n8 |
STRESS |
1942.22 |
535.81 |
2617.15 |
215.5 |
2401.65 |
|
ID |
STAGE |
MEAN |
STD |
MAX |
MIN |
RANGE |
|
n8 |
RECOVERY |
2260.38 |
1552.8 |
6286 |
1012.26 |
5273.74 |
|
n8 |
RECOVERY |
664.47 |
122.8 |
907.55 |
241.71 |
665.84 |
|
n8 |
RECOVERY |
8895.44 |
2753.22 |
14555.3 |
1052.73 |
13502.6 |
|
n8 |
RECOVERY |
976.13 |
315.39 |
2047.6 |
239.55 |
1808.05 |
|
n8 |
RECOVERY |
1468.55 |
528.1 |
2691.33 |
657.36 |
2033.97 |
|
n8 |
RECOVERY |
781.35 |
309.82 |
1776.48 |
296.64 |
1479.84 |
|
n8 |
RECOVERY |
857.77 |
391.98 |
1529.18 |
189.05 |
1340.13 |
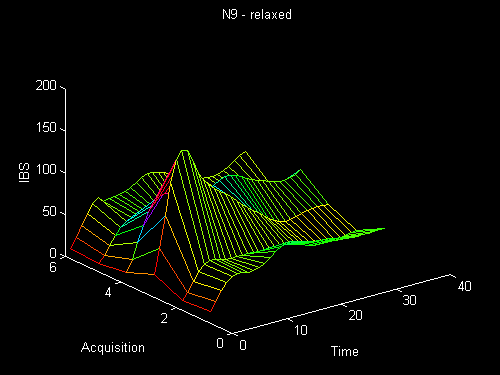
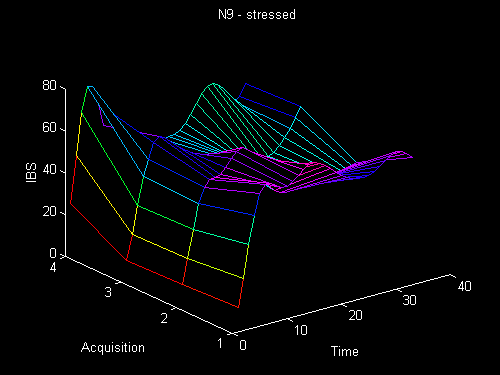
The next three tables and graphs belong to a 81 year old male with mild, concentric left ventricular hypertrophy and a trace of mitral insufficiency who underwent dobutamine stress echocardiography prior to vascular surgery. There were no stress induced left ventricular wall motion abnormalities. Surgery was uneventful.
|
ID |
STAGE |
MEAN |
STD |
MAX |
MIN |
RANGE |
|
n9 |
REST |
50.0954 |
9.9923 |
66.74 |
9.24 |
57.5 |
|
n9 |
REST |
37.7502 |
7.2888 |
45.57 |
6.73 |
38.84 |
|
n9 |
REST |
72.4333 |
34.5941 |
162.73 |
22.75 |
139.98 |
|
n9 |
REST |
75.2896 |
15.3969 |
93.78 |
10.1 |
83.68 |
|
n9 |
REST |
39.4771 |
8.0404 |
51.41 |
5.71 |
45.7 |
|
n9 |
REST |
68.8776 |
22.9029 |
119.59 |
8.6 |
110.99 |
|
ID |
STAGE |
MEAN |
STD |
MAX |
MIN |
RANGE |
|
n9 |
STRESS |
80.827 |
21.3043 |
108.72 |
12.78 |
95.94 |
|
n9 |
STRESS |
48.3932 |
10.6494 |
68.04 |
10.54 |
57.5 |
|
n9 |
STRESS |
49.7555 |
12.0894 |
68.19 |
9.78 |
58.41 |
|
n9 |
STRESS |
57.9126 |
19.9167 |
100.61 |
13.16 |
87.45 |
|
n9 |
STRESS |
48.83 |
13.9513 |
68.25 |
7.74 |
60.51 |
|
ID |
STAGE |
MEAN |
STD |
MAX |
MIN |
RANGE |
|
n9 |
RECOVERY |
78.941 |
23.2447 |
111.1 |
33.88 |
77.22 |
|
n9 |
RECOVERY |
82.3603 |
25.1694 |
139.89 |
19.74 |
120.15 |
|
n9 |
RECOVERY |
53.8115 |
15.8727 |
82.48 |
10.11 |
72.37 |
|
n9 |
RECOVERY |
40.5833 |
11.0513 |
60.86 |
9.47 |
51.39 |
|
n9 |
RECOVERY |
52.847 |
9.5153 |
67.82 |
12.54 |
55.28 |
|
n9 |
RECOVERY |
76.4207 |
34.088 |
153.26 |
7.4 |
145.86 |
|
n9 |
RECOVERY |
85.3295 |
23.8399 |
136.23 |
11.89 |
124.34 |
|
n9 |
RECOVERY |
148.356 |
37.7722 |
206.46 |
36.07 |
170.39 |
|
n9 |
RECOVERY |
66.607 |
19.3626 |
106.05 |
13.75 |
92.3 |
|
n9 |
RECOVERY |
43.763 |
10.7194 |
60.71 |
5.28 |
55.43 |
|
n9 |
RECOVERY |
66.301 |
19.5655 |
99.71 |
21.62 |
78.09 |
|
ID |
STAGE |
MEAN |
STD |
MAX |
MIN |
RANGE |
|
n10 |
REST |
252.455 |
72.368 |
420.93 |
35.87 |
385.06 |
|
n10 |
REST |
293.922 |
159.494 |
595.51 |
57.96 |
537.55 |
|
n10 |
REST |
172.576 |
90.44 |
389.79 |
57.81 |
331.98 |
|
n10 |
REST |
144.498 |
95.292 |
318.82 |
8.51 |
310.31 |
|
n10 |
REST |
151.538 |
55.605 |
294.81 |
31.49 |
263.32 |
|
n10 |
REST |
190.571 |
123.791 |
417.71 |
19.43 |
398.28 |
|
n10 |
REST |
170.92 |
157.26 |
634.82 |
0 |
634.82 |
|
n10 |
REST |
108.803 |
41.471 |
183.96 |
15.35 |
168.61 |
|
ID |
STAGE |
MEAN |
STD |
MAX |
MIN |
RANGE |
|
n10 |
STRESS |
122.904 |
35.704 |
210.75 |
31.92 |
178.83 |
|
n10 |
STRESS |
53.755 |
17.501 |
86.62 |
10.69 |
75.93 |
|
n10 |
STRESS |
76.736 |
24.021 |
132.41 |
9.53 |
122.88 |
|
n10 |
STRESS |
43.02 |
9.644 |
55.04 |
7.39 |
47.65 |
|
n10 |
STRESS |
116.793 |
35.703 |
183.97 |
23.01 |
160.96 |
|
n10 |
STRESS |
103.695 |
25.736 |
144.01 |
21.52 |
122.49 |
|
n10 |
STRESS |
88.999 |
34.811 |
180.46 |
19.8 |
160.66 |
|
ID |
STAGE |
MEAN |
STD |
MAX |
MIN |
RANGE |
|
n10 |
RECOVERY |
89.09 |
22.049 |
139.13 |
12.39 |
126.74 |
|
n10 |
RECOVERY |
89.113 |
30.495 |
146.04 |
16.51 |
129.53 |
|
n10 |
RECOVERY |
71.956 |
14.959 |
103.43 |
19.18 |
84.25 |
|
n10 |
RECOVERY |
69.51 |
16.969 |
111.05 |
22.34 |
88.71 |
|
n10 |
RECOVERY |
73.327 |
18.9601 |
120.72 |
18.94 |
101.78 |
|
n10 |
RECOVERY |
126.44 |
34.7206 |
235.72 |
37.19 |
198.53 |
|
n10 |
RECOVERY |
79.435 |
28.6238 |
149.47 |
14.4 |
135.07 |
|
n10 |
RECOVERY |
80.042 |
39.2925 |
194.85 |
11.5 |
183.35 |
|
n10 |
RECOVERY |
78.598 |
18.5773 |
125.92 |
21.42 |
104.5 |
|
ID |
STAGE |
MEAN |
STD |
MAX |
MIN |
RANGE |
|
n17 |
REST |
1254.24 |
535.69 |
2116.13 |
0 |
2116.13 |
|
n17 |
REST |
2373.98 |
1073.79 |
3836.85 |
126 |
3710.85 |
|
n17 |
REST |
788.2 |
288.18 |
1226.68 |
46.54 |
1180.14 |
|
n17 |
REST |
712.09 |
167.88 |
985.92 |
172.63 |
813.29 |
|
n17 |
REST |
707.7 |
308.58 |
1146.34 |
32.45 |
1113.89 |
|
n17 |
REST |
684.94 |
306.53 |
1136.08 |
58.98 |
1077.1 |
|
n17 |
REST |
1349.36 |
445.2 |
2090.26 |
235.11 |
1855.15 |
|
n17 |
REST |
753.19 |
363.57 |
1230.6 |
74.92 |
1155.68 |
|
n17 |
REST |
873.36 |
270.2 |
1281.52 |
106.26 |
1175.26 |
|
ID |
STAGE |
MEAN |
STD |
MAX |
MIN |
RANGE |
|
n17 |
STRESS |
5891.16 |
3742.77 |
14726.4 |
1149.03 |
13577.4 |
|
n17 |
STRESS |
18615.5 |
6827.15 |
30431.3 |
2971.45 |
27459.9 |
|
n17 |
STRESS |
22193.5 |
6944.37 |
28536.6 |
1797.82 |
26738.7 |
|
n17 |
STRESS |
14117.9 |
5615.86 |
22805.4 |
1908.82 |
20896.6 |
|
n17 |
STRESS |
27139.8 |
10616.4 |
44836.9 |
7000.41 |
37836.5 |
|
n17 |
STRESS |
4016.85 |
1352.27 |
5828.11 |
780.31 |
5047.8 |
|
n17 |
STRESS |
8860.01 |
3397.01 |
13429.8 |
844.95 |
12584.9 |
|
ID |
STAGE |
MEAN |
STD |
MAX |
MIN |
RANGE |
|
n17 |
RECOVERY |
414.14 |
178.65 |
703.73 |
42.93 |
660.8 |
|
n17 |
RECOVERY |
464.8 |
215.05 |
911.31 |
117.79 |
793.52 |
|
n17 |
RECOVERY |
4971.19 |
1685.78 |
7617.27 |
1015.46 |
6601.81 |
|
n17 |
RECOVERY |
21692.9 |
9398.34 |
35629.5 |
1226.77 |
34402.7 |
|
n17 |
RECOVERY |
24451.7 |
9494.59 |
39450.4 |
2434.88 |
37015.6 |
|
n17 |
RECOVERY |
2540.65 |
1080.45 |
3749.15 |
185.06 |
3564.09 |
|
n17 |
RECOVERY |
2387.22 |
732.05 |
3998.39 |
371.82 |
3626.57 |
The next three tables and graphs belong to a 56 year old male with normal left ventricular wall motion at rest. There was no left ventricular hypertrophy but pulsed wave Doppler evaluation of mitral inflow showed increased velocities after the atrial contraction indicating diastolic dysfunction. There were no left ventricular wall motion abnormalities during dobutamine stress.
|
ID |
STAGE |
MEAN |
STD |
MAX |
MIN |
RANGE |
|
n22 |
REST |
27.127 |
6.3411 |
34.72 |
2.72 |
32 |
|
n22 |
REST |
122.025 |
44.2037 |
225.45 |
27.58 |
197.87 |
|
n22 |
REST |
55.922 |
22.6644 |
102.5 |
4.2 |
98.3 |
|
n22 |
REST |
59.438 |
26.2922 |
110.82 |
5.47 |
105.35 |
|
n22 |
REST |
51.696 |
28.4758 |
105.98 |
4.51 |
101.47 |
|
ID |
STAGE |
MEAN |
STD |
MAX |
MIN |
RANGE |
|
n22 |
STRESS |
64.084 |
25.9659 |
102.16 |
9.24 |
92.92 |
|
n22 |
STRESS |
55.885 |
28.5734 |
111.66 |
3.2 |
108.46 |
|
n22 |
STRESS |
39.922 |
23.9917 |
73.19 |
2.28 |
70.91 |
|
n22 |
STRESS |
55.739 |
23.2253 |
87.12 |
3.59 |
83.53 |
|
n22 |
STRESS |
70.663 |
54.1065 |
206.32 |
4.54 |
201.78 |
|
n22 |
STRESS |
60.333 |
31.7416 |
125.63 |
3.83 |
121.8 |
|
n22 |
STRESS |
50.715 |
20.2477 |
79.47 |
3.77 |
75.7 |
|
n22 |
STRESS |
30.809 |
11.7976 |
52.68 |
6.05 |
46.63 |
|
ID |
STAGE |
MEAN |
STD |
MAX |
MIN |
RANGE |
|
n22 |
RECOVERY |
37.388 |
10.0571 |
49.39 |
3.25 |
46.14 |
|
n22 |
RECOVERY |
48.052 |
11.7826 |
63.79 |
6.65 |
57.14 |
|
n22 |
RECOVERY |
45.391 |
13.169 |
62.3 |
7.04 |
55.26 |
|
n22 |
RECOVERY |
34.637 |
8.8881 |
55.33 |
7.26 |
48.07 |
|
n22 |
RECOVERY |
59.996 |
18.6285 |
85.24 |
9.81 |
75.43 |
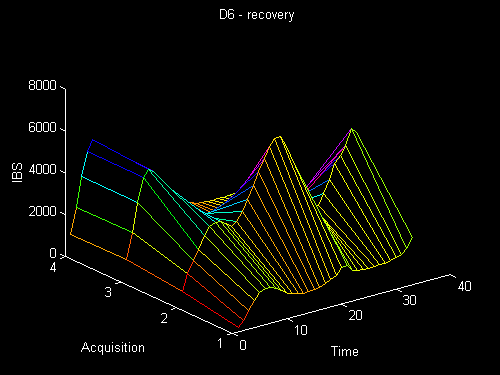
The next three tables and graphs belong to a 66 year old female who underwent stress thallium with an equivocal positive test. Given the fact that the pretest probability for coronary artery disease in this patient was low, she was referred for a dobutamine stress echocardiography as a second imaging modality to either confirm the thallium findings, or give a negative result, therefore reassuring that the patient does not require further evaluation with coronary angiography. The resting left ventricular wall motion was normal. With stress there was improved contractility in all left ventricular wall segments including the region sampled for integrated backscatter.
|
ID |
STAGE |
MEAN |
STD |
MAX |
MIN |
RANGE |
|
d6 |
REST |
4609.05 |
3004.85 |
10467.6 |
0 |
10467.6 |
|
d6 |
REST |
1618.11 |
618.44 |
2855 |
102.54 |
2752.46 |
|
d6 |
REST |
7591.56 |
4975.92 |
16405.9 |
1697.93 |
14708.0 |
|
d6 |
REST |
7387.44 |
3643.02 |
15397.6 |
2611.82 |
12785.7 |
|
d6 |
REST |
5723.61 |
3502.57 |
14562.0 |
1981.93 |
12580.1 |
|
d6 |
REST |
1594.72 |
633.18 |
3270.55 |
357.41 |
2913.14 |
|
d6 |
REST |
2917.23 |
702.79 |
4607.19 |
1012.04 |
3595.15 |
|
d6 |
REST |
2354.02 |
651.65 |
3574.04 |
418.19 |
3155.85 |
|
ID |
STAGE |
MEAN |
STD |
MAX |
MIN |
RANGE |
|
d6 |
STRESS |
1357.41 |
494.8 |
2215.93 |
124.05 |
2091.88 |
|
d6 |
STRESS |
1194.71 |
430.39 |
1938.18 |
270.12 |
1668.06 |
|
d6 |
STRESS |
833.65 |
227.1 |
1207.64 |
127.37 |
1080.27 |
|
d6 |
STRESS |
1617.08 |
1024.29 |
4721.77 |
785.3 |
3936.47 |
|
d6 |
STRESS |
1429.34 |
865.5 |
5246.43 |
308.01 |
4938.42 |
|
d6 |
STRESS |
1063.92 |
442.38 |
2178.01 |
313.72 |
1864.29 |
|
d6 |
STRESS |
663.43 |
149.1 |
918.64 |
104.88 |
813.76 |
|
ID |
STAGE |
MEAN |
STD |
MAX |
MIN |
RANGE |
|
d6 |
RECOVERY |
2458.76 |
1874.33 |
6912.35 |
210.09 |
6702.26 |
|
d6 |
RECOVERY |
4888.8 |
1521.96 |
7066.13 |
718.07 |
6348.06 |
|
d6 |
RECOVERY |
1762.28 |
1027.58 |
4309.65 |
258.45 |
4051.2 |
|
d6 |
RECOVERY |
1832.43 |
1139.56 |
5245.97 |
804.07 |
4441.9 |
|
ID |
STAGE |
MEAN |
STD |
MAX |
MIN |
RANGE |
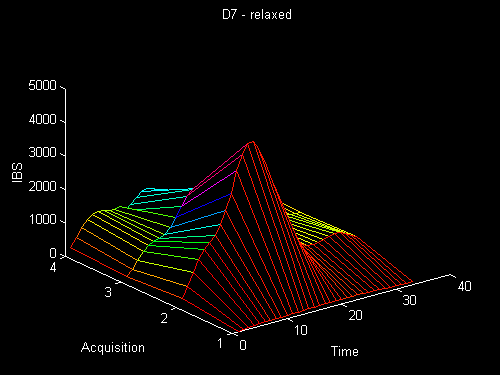
|
d7 |
REST |
113.37 |
33.08 |
151.3 |
0 |
151.3 |
|
d7 |
REST |
1388.3 |
999.89 |
4352.15 |
239.81 |
4112.34 |
|
d7 |
REST |
1148.71 |
495.2 |
2194.62 |
132.87 |
2061.75 |
|
d7 |
REST |
1282.43 |
797.83 |
3890.49 |
226.33 |
3664.16 |
|
ID |
STAGE |
MEAN |
STD |
MAX |
MIN |
RANGE |
|
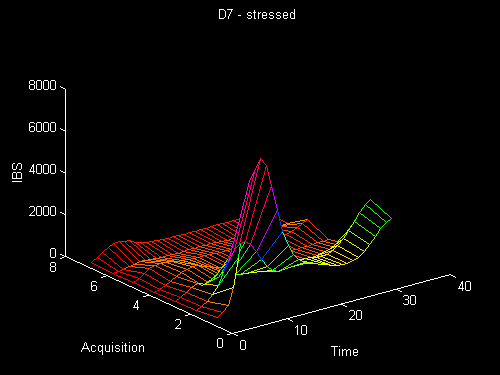
d7 |
STRESS |
2585.59 |
1836.09 |
7255.46 |
215.22 |
7040.24 |
|
d7 |
STRESS |
1727.17 |
788.94 |
3459.31 |
435.47 |
3023.84 |
|
d7 |
STRESS |
517.52 |
123.37 |
706.88 |
101.33 |
605.55 |
|
d7 |
STRESS |
460.8 |
199.73 |
963.65 |
48.59 |
915.06 |
|
d7 |
STRESS |
409.51 |
148.49 |
732.8 |
162.4 |
570.4 |
|
d7 |
STRESS |
184.07 |
53.19 |
315.75 |
40.45 |
275.3 |
|
d7 |
STRESS |
380.38 |
154.61 |
747.42 |
117.49 |
629.93 |
|
ID |
STAGE |
MEAN |
STD |
MAX |
MIN |
RANGE |
|
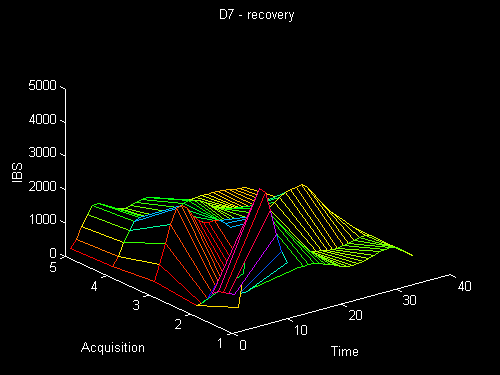
d7 |
RECOVERY |
1251.1 |
404.82 |
2264.86 |
224.84 |
2040.02 |
|
d7 |
RECOVERY |
940.79 |
576.37 |
2374.97 |
205.78 |
2169.19 |
|
d7 |
RECOVERY |
1258.55 |
447.97 |
1956.48 |
365.94 |
1590.54 |
|
d7 |
RECOVERY |
1176.34 |
456.65 |
2409.44 |
227.43 |
2182.01 |
|
d7 |
RECOVERY |
768.59 |
252.65 |
1331.57 |
191.88 |
1139.69 |
The next three tables and graphs belong to an 81 year old female who was referred for evaluation prior to vascular surgery. There was a history of prior inferior myocardial infarction. The regional wall motion analysis showed resting infero septal left ventricular wall hypokinesis. At low level stress this became more obvious as the remaining left ventricular segments improved their contractility. At high dose stress the contractility of the infero septal wall showed some improvement. Given the lack of improvement at low level stress this is indicative of limited myocardial viability but no inducible ischemia. This patient underwent vascular surgery as planned and did not develop any complications.
|
ID |
STAGE |
MEAN |
STD |
MAX |
MIN |
RANGE |
|
d9 |
REST |
3664.72 |
3418.68 |
13416.0 |
136.13 |
13279.9 |
|
d9 |
REST |
5612.63 |
4948.82 |
16134.2 |
392.37 |
15741.8 |
|
ID |
STAGE |
MEAN |
STD |
MAX |
MIN |
RANGE |
|
d9 |
STRESS |
344.18 |
121.99 |
504.83 |
30.04 |
474.79 |
|
d9 |
STRESS |
323.32 |
138.16 |
577.74 |
95.32 |
482.42 |
|
d9 |
STRESS |
489.47 |
264.57 |
1048.72 |
42.52 |
1006.2 |
|
d9 |
STRESS |
287.67 |
72.23 |
367.34 |
42.13 |
325.21 |
|
d9 |
STRESS |
248.94 |
77.5 |
344.92 |
24.21 |
320.71 |
|
d9 |
STRESS |
224.21 |
73.09 |
332.74 |
22.19 |
310.55 |
|
ID |
STAGE |
MEAN |
STD |
MAX |
MIN |
RANGE |
|
d9 |
RECOVERY |
918.86 |
327.23 |
1433.81 |
143.62 |
1290.19 |
|
d9 |
RECOVERY |
1307.97 |
624.06 |
2474.45 |
96.92 |
2377.53 |
|
d9 |
RECOVERY |
236.29 |
73.39 |
324.6 |
24.77 |
299.83 |
|
d9 |
RECOVERY |
881.26 |
356.91 |
1367.9 |
148.42 |
1219.48 |
|
d9 |
RECOVERY |
1261.99 |
373.65 |
1895.25 |
90.56 |
1804.69 |
|
d9 |
RECOVERY |
471.71 |
136.09 |
594.6 |
43.42 |
551.18 |
Back to E-chocardiography Home Page.
The contents and links on this page were last verified on December 24, 1998.