Mark Harry, R.D.C.S.
Iowa Heart Institute
This case illustrates the value of a comprehensive echo Doppler evaluation on a patient referred for optimization of his permanent pacemaker.
The patient was a 64 year old male, 69 inches tall, 175 pounds. Body surface area was 1.9 m sq. Blood pressure was 110/59.
Medications: ranitidine, simvastatin, rosiglitazone, digoxin, carvedilol, warfarin, amiodarone, nicotinic acid, enalapril, spironolactone.
The patient is a borderline diabetic with a long-standing history of coronary artery disease. In 1989 he had a coronary angiogram and underwent coronary bypass graft surgery. He had a LIMA (left internal mammary artery) to the LAD (left anterior descending artery), saphenous venous grafts to the left circumflex marginal and PDA (posterior descending artery) of the right.
Ejection fraction this time was estimated at 45%.
In 1993 the patient was admitted for recurrent chest pain. An angiogram showed severe diffuse distal disease with totally occluded LAD at the first diagonal, small circumflex artery with diffuse disease and occluded right coronary artery. The saphenous venous graft showed 60% narrowing. The patient was discharged on medical therapy.
In 1998 the patient was admitted for electrocardioversion for atrial flutter.
He was cardioverted into a sinus bradycardia with a heart rate in the 40s.
Eventually the patient had Medtronic Kappa-DR 401 pacemaker inserted. The pacemaker was programmed with a lower rate of 60 and an upper tracking rate of 120 and an AV paced delay of 180.
A routine echocardiogram was performed. Because the echocardiogram showed significant diastolic dysfunction the patient was referred to our pacemaker optimization clinic.
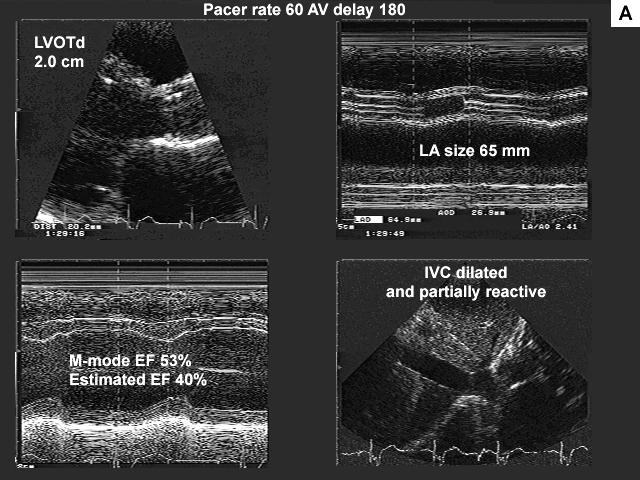
Images A, B, C, and D show the pertinent data from the baseline study.

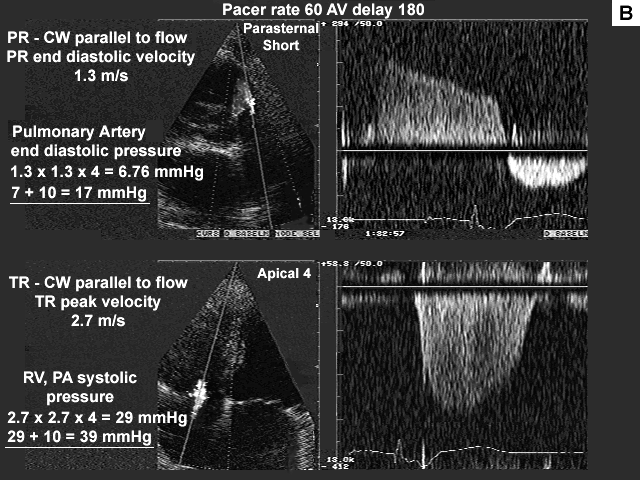
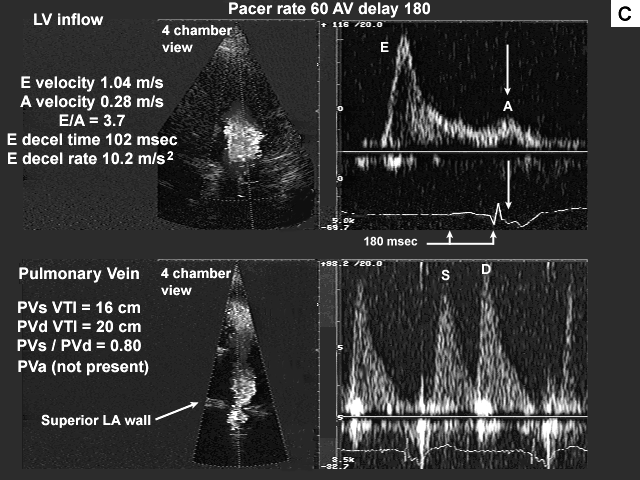
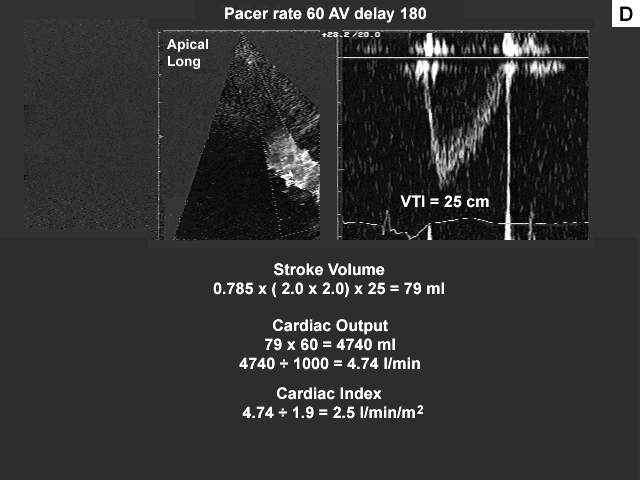
Summary of the echocardiographic findings from the baseline study.
The figure below illustrates the hemodynamic findings at baseline.
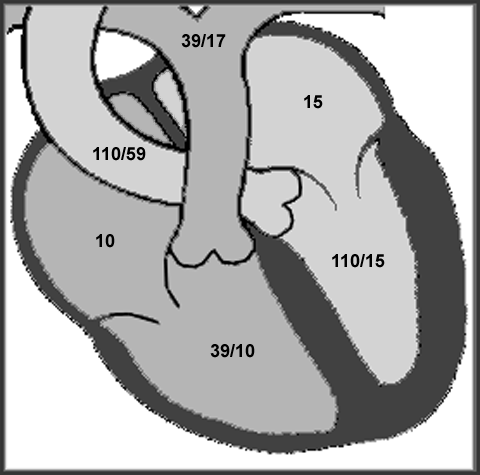
Because of this patient's significant regional wall motion abnormality the tissue Doppler method for estimation of mean left atrial pressure was not used. The left ventricular inflow data suggest left ventricular restriction with high left atrial pressure (figure C).
This may partly be due to the fact that the patient appears to have a significant intra atrial conduction delay. The A wave (mechanical atrial systole) occurs late, after the QRS complex. This might explain such a high E to A ratio. Also as the left atrium dilates (this patient's left atrium measured 65 mm by M-mode) there can be an associated decrease in left atrial contractility. This may or may not be the case in this patient.
The initial deceleration time is very short (102 msec), followed by a gradual runoff of flow from left atrium to left ventricle during a passive phase of diastolic filling (patient's heart rate is 60 bpm). This patient is relatively symptom free at rest with occasional dyspnea on exertion. The mitral inflow data alone do not correlate well with this patient's symptoms or clinical picture.
The pulmonary venous pattern suggests that the left atrial pressure is more in the range of 15 to 20 mmHg. The S to D ratio is close to 1.0 with a good amount of left atrial filling filling taking place during systole. If the left atrial pressure were greater than 20 mmHg, one would expect left atrial filling during systole to be significantly reduced due to a pressure and volume overload in the left atrium after diastole. The end diastolic pulmonary artery pressure of 17 mmHg (figure B) also suggests that the left atrial pressure is in a moderate range.
As a part of the Iowa Heart Institute protocol for pacemaker optimization we obtain Doppler data at several AV delays at the baseline heart rate. In this particular patient we obtained Doppler data at AV delays of 100, 180 (baseline), and 250 msec respectively.
The patient has a rate responsive pacemaker. This pacemaker responds to motion as well as minute ventilation. The upper tracking rate of this pacemaker was set at 120 bpm. The histogram from this pacemaker showed that the patient was tracking at rates of 90 to 95 bpm for significant periods of time during his daily activity. Since he complained of some occasional dyspnea on exertion we decided to obtain data at a pacing rate of 95 bpm.
The next set of images shows the data from the three AV delays at a pacemaker rate of 60 bpm. Also note the image showing the effect of Valsalva on the left ventricular inflow.
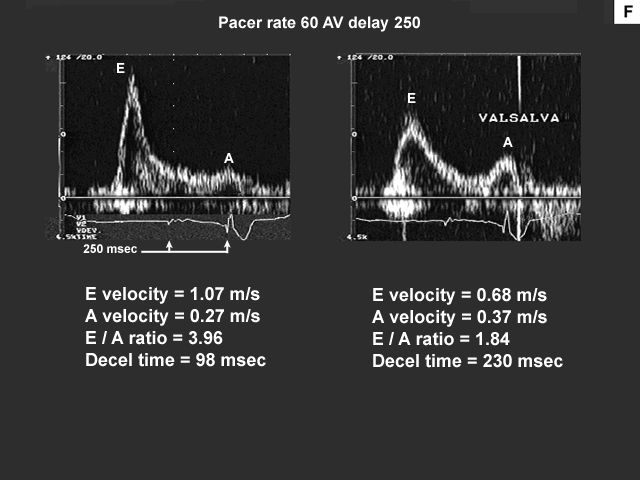
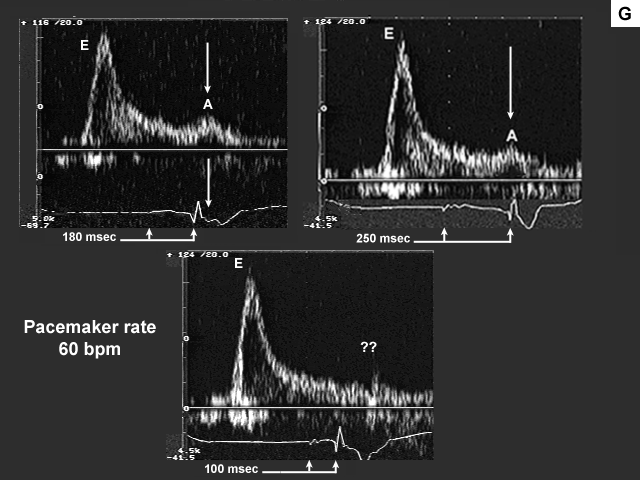
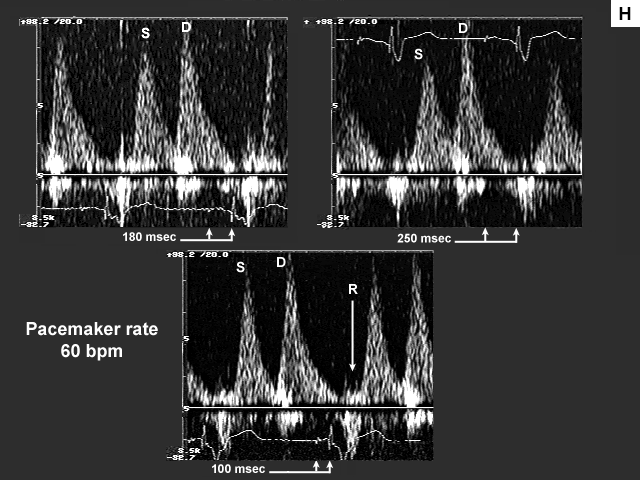
This patient demonstrates a restrictive left ventricular inflow pattern. The well preserved systolic component of pulmonary venous flow, which is reflected in the pulmonary venous S to D ratio, suggests that this patient has a restrictive reversible pattern instead of a restrictive irreversible pattern (image C). To confirm this observation we had the patient perform the Valsalva maneuver while sampling the left ventricular inflow with pulsed wave Doppler at the mitral valve leaflet tips.
The significant changes in the left ventricular inflow deceleration time and E to A ratio suggest that this is a restrictive reversible pattern (image F). The Valsalva maneuver can provide valuable information about the relationship between left atrial pressure and left ventricular compliance. The Valsalva results in this patient suggest that changes in this patient's medical therapy might lower his left atrial pressure/volume status, which could help to improve his occasional dyspnea on exertion.
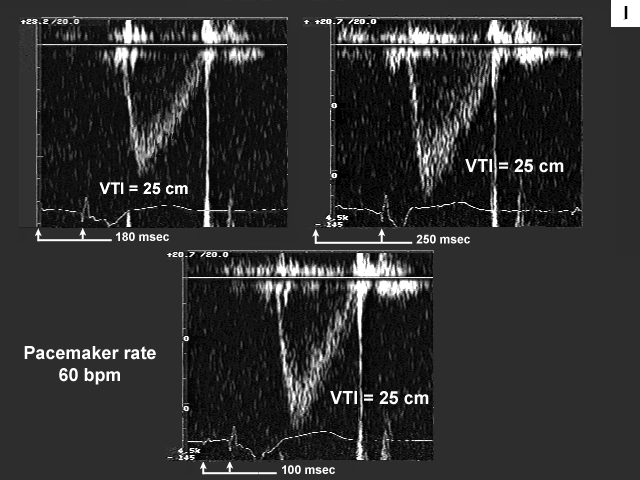
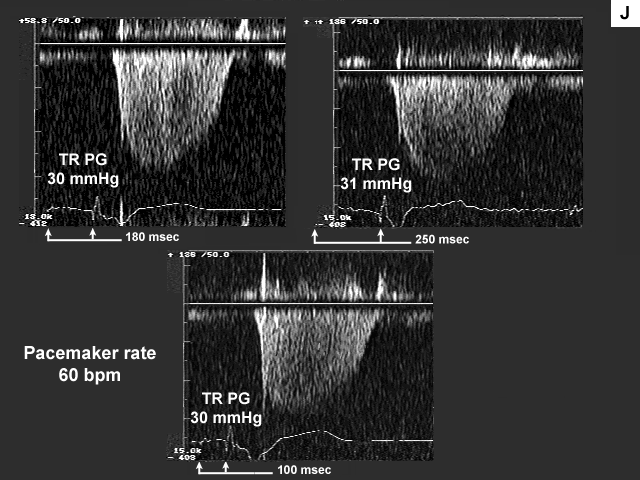
Images G, H, I, and J are the left ventricular inflow, pulmonary venous flow, left ventricular outflow, and tricuspid insufficiency data at a pacemaker rate of 60 with AV delays of 180 msec., 250 msec. and 100 msec. In image G mechanical atrial systole shifts to the left and ends at a more appropriate time when the AV delay is lengthened to 250 msec. At 100 msec there is no evidence of mechanical atrial systole because the atrium is now contracting in early systole after mitral valve closure. This is even more obvious on image H. There is significant flow reversal back down the pulmonary vein during atrial contraction, which occurs very late duri ng early systole (see arrow).
The next image (image I) is quite interesting. Please note that there is no change in the velocity time integral (stroke volume) across the aortic valve and the atrial contribution to left ventricular filling remains minimal (A velocity 0.28 m/s), at each of the AV delays (heart rate 60 bpm). Note also that the left atrium is markedly dilated (65 mm). These findings would tend to imply that the left atrium is near the "limits of its preload reserve" and the slight further increase in left atrial pre- and afterload imposed by the increase in AV delay (which results in a slightly shorter period of diastasis), is preventing the atrium from decompressing itself despite the fact that the atrium is now being given the opportunity to contract before mitral valve closure. Therefore changing AV delay under these afterload conditions does not have an effect on stroke volume.
What is so tantalizing about this particular case is the fact that when left atrial pre- and afterload are meaningfully reduced by Valsalva, left atrial systolic function improves significantly (increase in A velocity). Accordingly, once preload and afterload have been effectively reduced (by introduction of diuretic therapy, for example) one might then repeat pacemaker optimization. In the interim, one should ensure that the AV delay is sufficiently long to prevent premature atrial contractions during ventricular systole. It should be understood however, that one would not expect significant improvement in symptomatology until left atrial preload and (afterload) have been reduced.
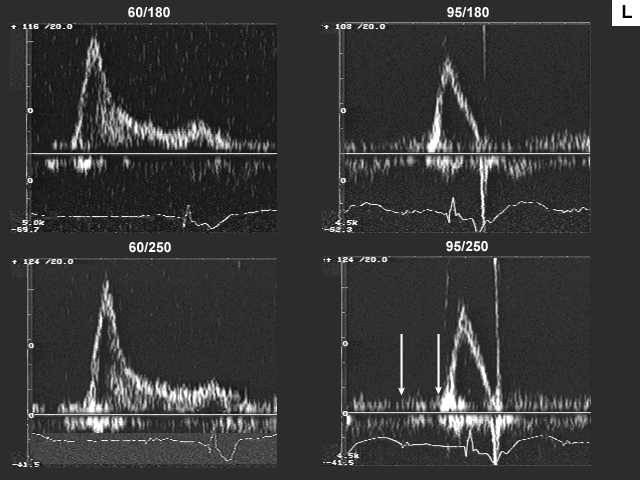
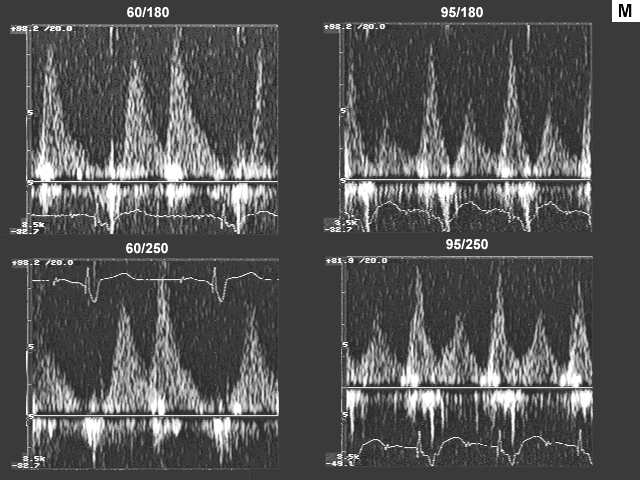
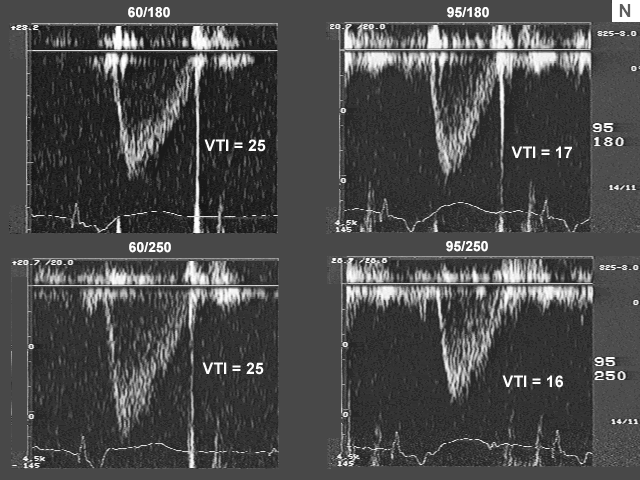
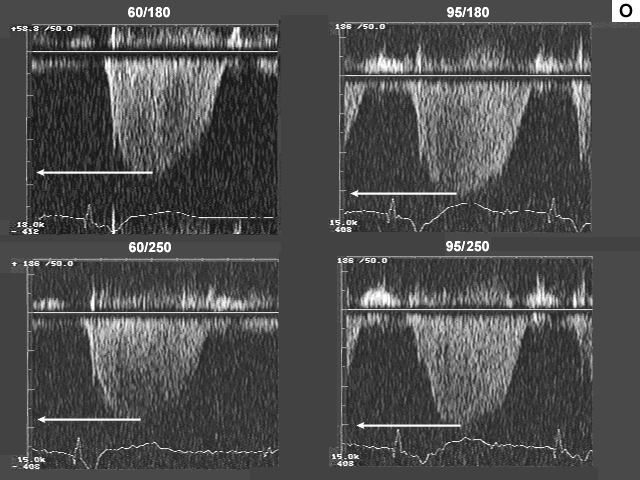
The last set of images compare the data from two AV delays at pacemaker rates of 60 and 95 bpm.
Images L, M, N, and O are the left ventricualr inflow, pulmonary venous flow, left ventricular outflow, and tricuspid insufficiency data at a pacemaker rate of 60 and 95 with AV delays of 180 msec. and 250 msec. In image L there is a significant drop in left ventricualr inflow velocity at a rate of 95 and the diastolic filling time is extremely short. Image M shows a dramatic shift downward in the S to D ratio. These data indicate that there is a significant increase in left atrial pressure at the higher heart rate.
The fact that peak inflow velocity has decreased despite increase in left atrial pressure implies decrease in forward flow per beat. The decrease in forward flow per beat that was suggested by left ventricular inflow data is confirmed by left ventricular outflow findings (image N), which indicate reduction in stroke volume. Despite the decrease in stroke volume, cardiac output and cardiac index, are maintained because of the increase in heart rate.
Finally, image O indicates that the increase in left atrial pressure is being reflected back through the lungs to the right heart, since right heart pressures are higher at the higher heart rate.
Back to E-chocardiography Home Page.

The contents and links on this page were last verified on December 14, 2000.