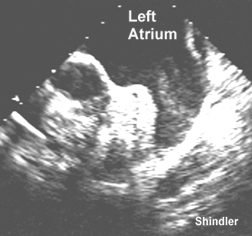
Transesophageal echo showing spontaneous contrast "smoke" in the left atrial appendage.
Clin Cardiol. 2000 Jul;23(7):501-6.
The effect of transient balloon occlusion of the mitral valve on left atrial appendage blood flow velocity and spontaneous echo contrast.
Wang J, Chung Ann Choo D, Zhang X, Yang Q, Xian T, Lu D, Jiang S.
Department of Cardiology, Sir Run Run Shaw Hospital, Hangzhou, China.
BACKGROUND: Spontaneous echo contrast (SEC) is a phenomenon that is commonly seen in areas of blood stasis. It is a slowly moving, cloud-like swirling pattern of "smoke" or increased echogenicity recorded on echocardiography. SEC is commonly seen in the left atrium of patients with mitral stenosis or atrial fibrillation. The presence of SEC has been shown to be a marker of increased thromboembolic risk. HYPOTHESIS: By using transesophageal echocardiography during percutaneous balloon mitral valvotomy (PBMV), the study investigated the relationship between SEC and varying left atrial appendage (LAA) blood flow velocity in the human heart. METHODS: Thirty-five patients with rheumatic mitral stenosis underwent percutaneous balloon mitral valvotomy with intraoperative transesophageal echocardiography monitoring. We alternatively measured LAA velocities and observed the left atrium for various grades of SEC (0 = none to 4 = severe) before and after each balloon inflation. RESULTS: Left atrial appendage maximal ejection velocity was reduced from 35 +/- 14 to 6 +/- 2 mm/s at peak balloon inflation and increased to 40 +/- 16 mm/s after balloon deflation. In comparison with the values before balloon inflation and after balloon deflation, LAA velocities were significantly lower (p < 0.001). New or increased SEC grade was observed during 54 of 61 (88%) inflations and unchanged in 7 (12%) inflations at peak balloon inflation. Spontaneous echo contrast became lower in grade after 55 balloon deflations (90%), completely disappeared after 18 deflations (30%), and remained unchanged after 6 deflations (10%). The mean time to achieve maximal SEC grade (2.5 +/- 1.2 s) coincided with the mean time to trough LAA velocities (2.3 +/- 1.1 s) after balloon inflation. Upon deflation, the mean time to lowest SEC grade (2.9 +/- 1.8 s) coincided with mean time to achieve maximal LAA velocities (2.7 +/- 1.6 s). CONCLUSION: During balloon inflation, the severity of SEC was enhanced with corresponding reduction in LAA flow velocity. Upon balloon deflation, SEC lightens or disappears with increase in LAA flow velocity.
Back to E-chocardiography Home Page.

The contents and links on this page were last verified on April 7, 2005.